“The more things change, the more they stay the same” –Jean-Baptiste Alphonse Karr
Stocks have taken a really wild ride lately. Starting last Thursday, they had a free fall down 10%, then they recovered about 6% of that. Things finally settled down on Friday when the market finished virtually unchanged.
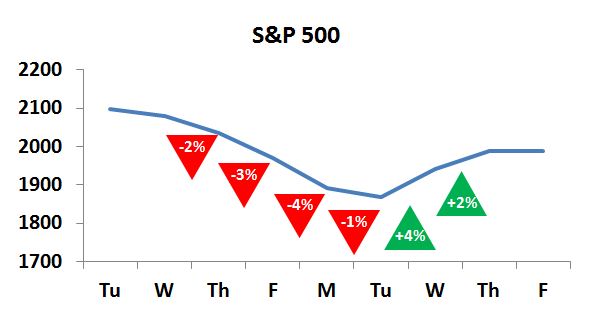
There was actually a streak of 6 days where stocks moved at least 1%. Generally speaking a 1% move is pretty big (in this market it’s about 170 points on the Dow). To have that happen 6 days in a row seemed pretty extraordinary. More than the steep drops, I think it was the relentless “huge” moves everyday that particularly put my nerves on edge. I think I can better handle just a crazy day and then accept that it’s over. Kind of like an earthquake in Southern California; it’s violent and scary, but it just lasts a couple seconds, then it’s over and you know you need to start getting on the business of recovery.
So I wanted to ask two questions:
How often does the market move 1% for so many days in a row?
Before this streak of 6 days in a row, the next longest streak in 2015 was for 3 days. The longest streak in 2014 was 5 days, the longest streak in 2013 was only 3 days, and the longest streak in 2012 was 2 days. So that starts to tell me that a 6 day streak is not all that common.
In fact, you have to go back to 2009 and the aftermath of the Great Recession to have a streak of 6 days. However, that was the tip of the iceberg. During that time there was also a streak of 8 days, another of 7 days, and two separate streaks of 10 days in a row where the market moved at least 1%.
I think that puts what we just went through in perspective, both for the good and the bad. First, what we went through was a pretty big deal. Crazy weeks like that don’t really happen all that often, and you survived it so congratulate yourself.
That said, compared to the Great Recession, this was just a small blip. And that feels right. During the depths of the Great Recession, people were actively questioning the viability of capitalism and the stock market, and there was a real sense of capitulation. Those days have left deep scars for many, a lot of whom have sworn off stocks just because that was such a tough time for investors.
I never felt anything close to that during this roller coaster. When things were falling, sure it sucked, but I sensed that most people were looking at it as a blip that would prove a good buying opportunity (as turned out to be the case). Sure, it was frustrating when we finished one bad day and then follow that up with another bad day, but again it never seemed people were losing faith.
Put all that together, and I’ll call this a class 2 hurricane. It caused damage and but no lives were lost. We’ll forget this in a few months. That’s very different from a class 4 hurricane (Great Recession) or class 5 (Great Depression).
Has the market gotten more volatile in recent years?
The other thing that occurred to me was is all this market volatility increasing. You hear people talking all the time about how the market is changing, typically for the worse. I don’t buy a lot of those arguments, but I do believe that the market is changing in undeniable ways—computers are driving more trades, investing is becoming an international game, investors are getting savvier, information travels much more quickly, and you could go on and on.
I pulled data on the S&P 500 going back to 1950 when the index began. I counted the number of days where the market moved at least 1%, and I was fairly surprised by the results:
|
Up 1% |
Down 1% |
|
| 2010s* |
12% |
11% |
| 2000s |
16% |
17% |
| 1990s |
11% |
9% |
| 1980s |
13% |
11% |
| 1970s |
10% |
10% |
| 1960s |
4% |
5% |
| 1950s |
7% |
6% |
Looking at the data a few things stand out. First, there seemed to be a big change around 1970. Before that about 10-13% of the trading days had big moves. But since the 1970s, those days jumped up drastically to at least 20%. I tried to think what would have caused this stark change and I couldn’t come up with anything. Sure, the world has changed drastically since the 1950s, but was the change from the 1960s to the 1970s any greater than, let’s say, the 1990s to the 2000s? I don’t think so, but something happened. The data’s definitely there.
Second, the 2000s were the most volatile decade in this data set. If you look back then, that makes sense. The decade was bookended by two disastrous periods for investors—the tech bubble popping in 2000 and the Great Recession in 2008. Both periods put stocks in an absolute frenzy, diving one day then freighting a recovery the next. I’m not old enough to have lived through the Great Depression or the lost decade of the 1970s, but I did feel I cut my teeth in the 2000s. I suppose in a perverse way, it’s comforting to know how crazy of a time that decade proved to be.
Finally, and most topical, is that the 2010s, so far are a pretty average decade as far as volatility goes. Sure you had the past week and a half which was a whirlwind, but as we saw at the top of this post, the previous years were pretty calm. This decade compares pretty favorably to the 1990s, 1980s, and 1970s.
I think it’s important to put this in perspective and somewhat debunk all the doomsdayers who tell us that things are so different. The opening quote, “the more things change, the more they stay the same,” which to further prove it’s point was first coined in the early 1800s, seems to prove its wisdom. Sure we can get caught up in all the craziness of the past few days, and that’s okay. But let’s not lose sight of the fact that this is just the way the stock market is and has been for a very long time.
* 2010s are through 28-Aug-2015.
Do you think this is a market correction?
I personally don’t think it was a correction. Sure, stocks were down 10%, and that is typically the definition of a correction, but then they snapped back 6%, so net-net they were only down 4%. I think to be a correction it has to last longer than a day.
If it happens that fast, I just attribute it to emotions running out of control. For me a correction would be if it fell 10% or 20% and then people kind of accepted that as a new normal and then things built from there over a few years. This was just a blip and then a counter-blip.