Making money in the Covid market

I’m trying to build my audience, so if you like this post, please share it on social media using the buttons right above.

It certainly looks like the stock market has recovered from the Covid pandemic.  Sure, some people may say it will crater again in the fall when flu season hits, but I don’t think it will.

The 2020 stock market seems like a movie.  Things started off great and then there was a huge disaster.  When things looked their bleakest, we saw things turn around, and in the end we had a happy ending where things were even better than before.  Star Wars, Harry Potter, Lord of the Rings, and now the 2020 stock market.

Buried in this roller coaster was a tremendous way to make a lot of money in the stock market.  I’m not talking about predicting the future where you had the perfect foresight to sell in February and then buy back on March 23 when things bottomed out.  That’s impossible.

However, I am talking about a tried and true method of investing that we talk about all the time-dollar cost averaging.

Dollar cost averaging during Corona

If you need a quick reminder, dollar cost averaging is taking the money you want to put in the market, and investing equal amounts each week or paycheck or whatever.

For example, let’s assume that you invest $1000 per month ($250 per week).  If you were able to do that and could keep your discipline, you would have made about $1200.  In fact, because of the Corona market crash, you would have made about $900 more than if 2020 had been smooth sailing.  Let me explain:

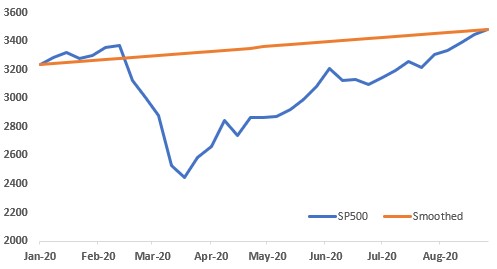
The S&P 500 started the year 2020 at about 3200, and now it’s at about 3500, a bit less than a 10% increase.  If we lived in a pretend world where the stock market smoothly and steadily increased from 3200 to 3500 over these past eight months, you would have invested $250 each week and would now have about $9300.  That first week you would have gotten so many shares for your $250, and then each subsequent week the stock market would increase, so your overall portfolio would rise in value but the number of additional shares you bought each week would decrease.  But hey, you’re up, so that’s good.

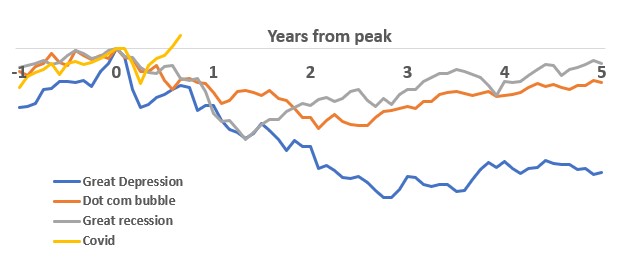
However, what really happened, although much crazier and more stressful ended up being better for you at the end of the day.  We know that that 2020 stock market wasn’t smooth—it increased early on then had a massive, once in a century crash, after which it had about as steep a V-shaped recovery as we’ve ever seen.

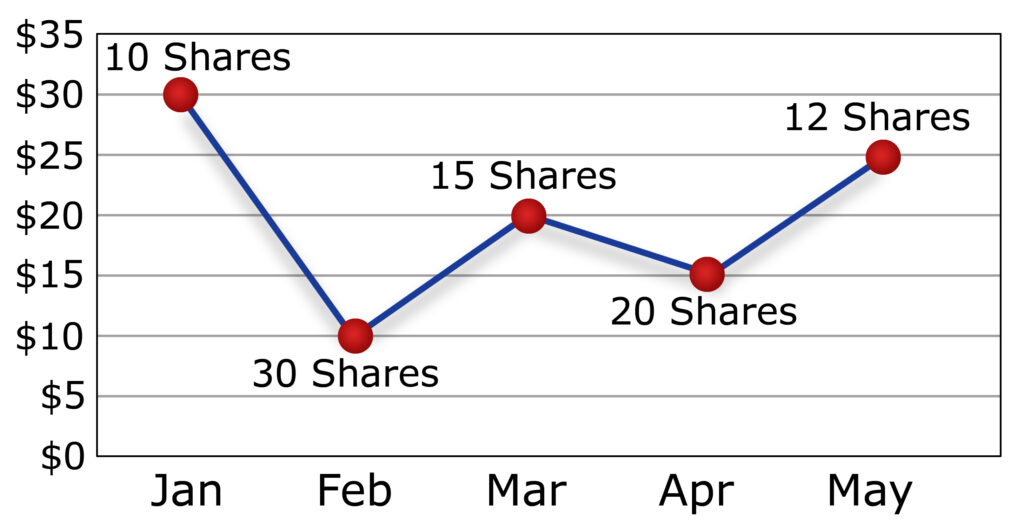
If you were investing that same $250 each week, things would have seemed pretty normal the first two months.  However, once March hit the stock market cratered.  The value of your investments plummeted which was bad, but the silver lining was that each month you were buying additional stocks at a much lower price.  That meant you were getting more shares for each $250 you put into the market.

At the depths of the crisis, if you were able to keep your investing discipline, you were buying stock at about 30% off.  Think of it like getting stock from Kolh’s instead of Macy’s; exact same stuff just on sale.  Even after the market started its recovery, you were still able to get stocks at cheaper than you would have in that fantasy, smoothed-out scenario.

If you do all the math, it actually adds up to some pretty decent cheddar.  Through those eight months, at $250 each week, you would have invested a total of $9,000 (36 weeks).  That’s probably not too far off from what you may normally invest in your 401k.

In the smoothed scenario, you would have grown that $9,000 to $9,342, a profit of $342.  That seems pretty good given everything we have gone through so far in 2020.

 Real life CoronaPretend smoothed
Amount invested each week$250$250
Weeks3636
Total amount invested$9000$9000
Investment value at end of August$10,233$9,342
Investment gains$1,233$342

However, in real-life, thanks to dollar cost averaging, you would have grown your $9,000 to $10,233, a profit of $1,233.  Obviously, that’s quite a bit more and it speaks to the power of investing discipline.

When things were their worst, in late March, it was hard, really hard, to keep the faith and continue to put money into the market.  However, like every other time in the modern history of the stock market, if you were able to follow Rudyard’s advice and keep your head, things came around.

Obviously there’s a moral to this story which is Investing is a long term game.  The Corona stock market came and went over the course of a couple months.  Things looked terrible but then they improved.  If you can stay disciplined, the stock market will give you its riches.

The way to save the most black lives

If we as a society truly think Black Lives Matter, then we need to find actionable ways to save the most black lives possible.  Deaths of black people by police number about 200-300 annually.  Even if you assume all of those deaths were preventable, that is only a minute fraction of the lives that could be saved by black men living with their children and the mothers of those children.

SINGLE-PARENT HOUSEHOLDS (SPH) BY RACE

Nationally, about 35% of US households are headed by a single parent.  However, that varies drastically by race.  65% of black households are single-parent, the highest level for any ethnic group.  The group with the lowest percentage of single-parent families is Asian and Pacific Islander.  Whites are at 24%, American Indians are at 53%, and Hispanics are at 41%.

At a very high level, there is a remarkable correlation between single-parent households and other factors like reflect societal success like income, net worth, crime/incarceration, education.

RaceSingle parent households (SPH)% with high school diplomasAverage incomeAverage net worthIncarceration per capita (per 100k)
Asian/PI15%92%$87,194$210,100115
White24%89%$63,179$114,700450
Hispanic41%81%$51,450$21,420831
Native American53%74%Not listedNot listed1,291
Black65%79%$41,361$12,9202,306

The data show an obvious trend—Asians are the best ranked along every dimension, followed by whites, then Hispanics, and finally blacks.

Correlation does not equal causation.  To reach such conclusions would take enormous, expensive surveys.  Even then it might not be possible to tease out all the other important factors and isolate “single parent households”.  The rest of the analysis assumes there is a causation.  You are free to disagree.

INCREASED DEATHS WITH SINGLE-PARENT HOUSEHOLDS

Intuitively it makes sense that the people associated with single-parent households—both the kids, the parent living with the children, and the parent living without the children—are at increased risk.  The biggest culprit is wealth, or lack thereof; single-parent households tend to be poorer and with that comes a myriad of detriments: less healthcare, less nutrition, living in higher crime areas, and many more.

Beyond just the financial component, there are other reasons to think single-parent households increase mortality.  For the kids, there’s obvious value in having two parents.  Kids are less likely to have accidents if two set of eyes are watching instead of one.  Life-skills, especially those taught by a regularly present father may lead to less participation in drugs, crime, and gangs.  Depression and suicidal thoughts would seem easier to address with two parental resources rather than just one.

Much of this would apply for the adults as well.  The reduced stress of having to be “everything” for the parent with the kids would be reduced.  For the parent not with the kids, most often the father, being with his family likely has a positive impact.  He has something more to live for and a loving family to come home to—perhaps he takes better care of himself with diet and exercise, engages in less criminal activity, seeks to improve his professional prospects to support the children he sees every day.  This is all conjecture and would of course need to be supported by data, but it certainly passes the stink test.

Sadly, the research in this area is sparse and not comprehensive.  Also, it is riddled with correlation/causation and other statistical issues.  However, the research that has been done statistically significantly concludes that single-parent households lead to premature deaths . . .  for all involved.  Mortality for children increase by about 40% to 100%, for the parent who lives with the children (typically the mother) by about 50%, and even for the parent not living with the children (typically the father) by about 200%.

Both boys and girls of single-parent families have increased mortality, but this increased mortality is doubled for boys compared to girls.  Suicide is about twice as common for single-parent children, with a greater impact on girls than boys.  Death due to household accidents is about 40% more common for girls and 270% more common for boys.  Death due to addiction is about 400% more common. All really, really sad stuff.

The data also show that the risk among single-parent children, already much higher, is especially deadly for young kids.  Infants and toddlers in single-parent households have about a 100% mortality increase while the older kids have a 30% increase.

Reasonable people can debate the precise statistical impact, but the data seems to clearly show these broad trends:

  • Kids of single-parent households have increased mortality, and it is worse for younger kids and for boys.
  • Both parents associated with single-parent households have increased mortality, and that worse for the fathers/parents not in the household.

ACTUAL LIVES LOST

We can estimate the annual deaths caused by single parent households.  The data is incomplete so we have to make a few assumptions on population size, but those probably don’t have a large impact on the final calculations, and certainly not on the conclusions that single-parent households are leads to thousands of black deaths.  The rest is just math that we learned in 4th grade.

In the United StatesPopulation (millions)Annual death rate (all population)Incremental death rate due to SPHIncremental deaths associated with SPHIncremental deaths reduced by SPH rate for blacks going to US average
Black kids (4 and younger) in SPH2.00.12%0.12%2,4001,292
Black kids (5 and older) in SPH6.30.10%0.03%1,8901,018
Black mothers (age 19-50) associated with SPH6.10.13%0.06%3,6601,970
Black fathers (age 19-50) associated with SPH6.10.23%0.46%28,06015,109
TOTAL   36,01019,390

Applying those increased death rates to the populations of kids, mothers, and fathers associated with single-parent households, we get about 36,000 deaths of black people each year due to single-parent households.  Assuming that black single-parent household rate fell to the US average, (being reduced from 65% to 35%), that still is over 19,000 incremental black deaths.

Most sobering are the kids.  Over 2,300 black kids are dying each year because of greater single-parent households (more than 6 every day).  And this is mostly focused on babies and toddlers.

We all want a better world.  We all want fewer black people dying.  Reforming law enforcement will likely lead to a few reduced black deaths.  Increasing two-parent households will save orders of magnitude more black lives, especially the most precious black lives, the black kids.

Now, that’s what I call a recovery

I’m trying to build my audience, so if you like this post, please share it on social media using the buttons right above.

Sorry for the extended absence from writing the blog.  Like many of you foxes and vixens, I have been homeschooling the kits, and that has kept me pretty busy (and on the brink of sanity).  The boys started school last week (they go to school two days per week and do remote learning three days per week), so that gives me a little bit of time to get back into the swing of things with my blog.

Picking our way out of the rubble

2020 will obviously be remembered as the year of Covid.  They year is not over yet, and we still have a presidential election.  But I sure hope that nothing else this year can supplant Covid for the title of “Craziest Crap to Happen in 2020”.  I’m a bit nervous.

From a personal financial perspective, this was on the Mt Rushmore of stock market calamities, along with the Great Depression, the Internet Bubble, and the Great Recession.  At the depth of the freefall in March, the Covid market was actually worse than the Dot-com burst and the Great Recession.  And not just by a little bit: Covid was down 20% while Dot-com and the Great Recession where down 13% and 11% respectively at that same point in time.

However, a few months later everything is as good as it was before the nightmare started—actually better.  Today, stocks are higher than they were before the Covid hit the fan.

You know how they say “a picture is worth a thousand words”?  Here is a picture that shows those four stock markets.  Crazy, huh?

We’ll remember this one for a while.  In March, the speed and severity of the fall was matched only by the Great Depression.  When you have to go all the way back to the Great Depression to find a similarly horrible market, you know you’re dealing with some serious stuff.

Yet, the recovery was arguably more extraordinary.  Those other examples had a downward slide measured in years, not months.  At it’s worst, the market lost over half it’s value.  But what really puts the cherry on top for me is the time it took to recover.  Those other markets took years (decades in the case of the Great Depression); Covid just took a couple months. 

 After 3 monthsNadirNew high
Great Depression-34%-83% after 3 years25 years
Dot-com bubble-13%-46% after 2 years12 years
Great Recession-11%-53% after 1 year5 years
Covid-20%-20% at 3 months7 months

Covid market in perspective

I don’t think in March anyone would have predicted something like this.  Personally, I thought we’d be at 3000 on the S&P 500 by July (about 10% down from the market highs).  At the time, I thought I was crazy optimistic.  As it turned out we were at about 3200, a new high.

That said, this one will leave a scar.  No matter how optimistic one is, it will be impossible not to remember that hollow feeling investors had in their stomachs in March.  If you were able to keep your head this turned out to be inconsequential.  If you sold then you really did yourself a disservice with regard to wealth building.

I imagine that along with the Dot-com and Great Recession, the Covid market will be responsible for thousands of people not participating in the market.  They say, “I remember Covid and I just don’t trust the market.”  They’ll not invest and really hamper their ability to generate a large nestegg.  I suppose we’ll see on all this stuff.

That said, I’m glad we’ve made it out the other end on this okay.