What’s causing the volatility? Part 1

0906_market-volatility_270x190

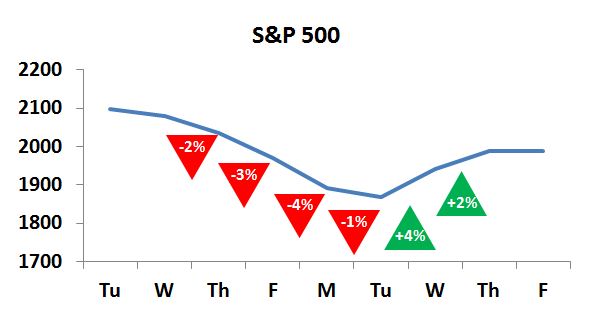
On Tuesday I responded to an email from a worried Mimi Ocelot about the free-fall the stock market is going through right now.  I provided a historical perspective of what is going on.  In this post I am going to give some reasons I think we’re experiencing all this increased volatility.

And I need to apologize.  I started writing this and it got so long (I try to keep my posts at about 1000 words) that I need to split this into a part 2 and a part 3.  So enjoy this and then tune in tomorrow for the exciting conclusion.


“The times they are a changin’”—Bob Dylan

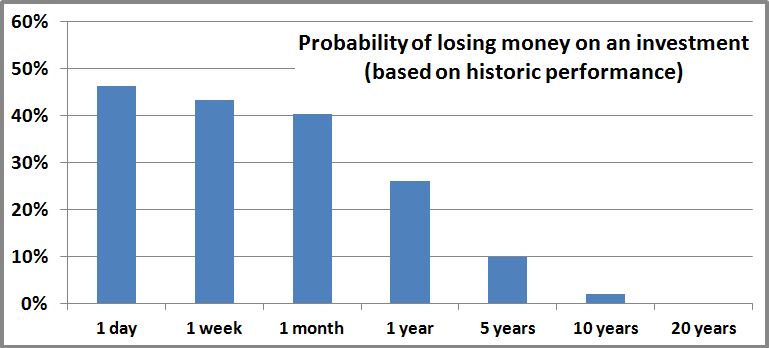
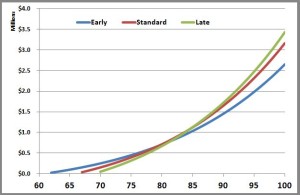
As I wrote here, the volatility in the market is definitely going up.    Of those 17 two-week periods as bad as this one since 1950 that I mentioned on Tuesday, eight occurred in the fifty years from 1950 to 2000 which means that nine occurred in the fifteen years from 2000 to 2016.  There’s no question that the market has become MUCH more volatile lately.  Is this a temporary thing or a new normal?  Who knows, but I tend to lean towards “new normal”.  Now let’s try to figure out the “why” part of this mystery.


“Ready, Fire, Aim” –Tom Peters (1982)

Nearly everyone agrees that information is the lifeblood of the stock market.  Today, that information travels so much faster than in the past.  Something could happen in the most remote corner of the world, and you would know about it in everywhere in a matter of seconds or minutes.  Obviously quicker access to news is a good thing for society at large, and investing in particular, but it definitely exposes many investors to making big mistakes because they are acting so quickly.

marquee-787

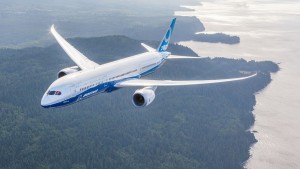
A good example is July 12, 2013.  On that day a Boeing 787 caught on fire a Heathrow Airport in London.  Here’s some quick historic context: the 787 was Boeing’s next generation aircraft that was going to revolutionize air travel, a plane Boeing pretty much staked its entire future on.  In early 2013 two 787s caught fire, leading to the FAA and its counterparts around the world to ground all 787s until Boeing figured out the problem.  Boeing’s stock, as you would expect, got hammered.  It took Boeing several months, but they fixed the problems, got the 787s in the air again, and their stock recovered.

Then July 12 happened.  News broke that another 787 caught on fire.  Investors, understandably, concluded that the problems weren’t fixed after all and that the planes would be grounded again.  In a matter of minutes the stock cratered, falling from about $108 per share to $99.  Over the following hours and days, it became clear the July 12 fire had nothing to do with the previous problems; it was just one of those things that do happen every once in a while.  No big deal.  Two weeks later, Boeing’s stock was back to the pre-July 12 fire levels.  It was all like nothing happened; except it did happen and there was crazy volatility in the stock.

The morale of the story is that investors got the information so quickly and rushed to act on it so quickly, that they completely misevaluated the situation, and that led to a lot of volatility.  Had the news traveled more slowly, the world would have had more time for more of the facts to come out.  No matter how you slice it, the light-speed fast news makes the pace of investing faster, and when you do something faster, you tend to make more mistakes.


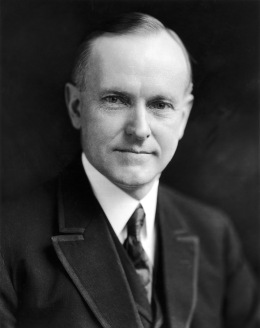
 “The chief business of the American people is business” –Calvin Coolidge (1925)

UNITED STATES - AUGUST 03: Official Portrait Of Calvin Coolidge On August 3, 1923, Then Vice President Who Succeeded Harding As President. He Was Elected In 1925. (Photo by Keystone-France/Gamma-Keystone via Getty Images)

We Americans are probably a bit spoiled.  There have been no wars fought on our soil since 1865 (I didn’t count Pearl Harbor, which reasonable people can debate).  There has been a consistent government since 1787 (or 1865 depending on how you think about the Civil War) without any coups or revolutions.  There’s never been a military takeover of the government, and the US government has never defaulted on its debt.  You could go on and on.

The reason that is important is that today about one third of all earnings in the S&P 500 come from outside the US.  It’s hard to find out what that number was in 1950 or 1960, but suffice it to say that that number was much, MUCH lower back then.  So we have a lot more international exposure now than in the past.

That’s a good thing because of diversification.  But it does expose us as investors to some of the geopolitical challenges that I just mentioned, that the US has been blessed to have avoided.

Also, to President Coolidge’s quote, the US tends to be oriented towards business (and some, but not I, would argue too oriented towards business).  This has definitely helped us become the largest and strongest economy in the world.  But other countries have other orientations (I’ll try not to use too blatant of stereotypes to offend my international readers): the Middle East is very theocratic, Japan focuses on saving face (keeping it from writing off bad debts which has stalled its economy for two decades), China is very authoritarian, Europe is more socialistic.  That doesn’t mean any of those other perspectives is bad.  But it does mean they are less likely to drive greater business and productivity, and those are not good if your goal is to have your stocks grow.

If you’re exposed to those geopolitical landmines as well as those competing priorities, it shouldn’t be surprising that the road won’t be as smooth.  And that’s just French for saying more volatility.


“The world is getting smaller” –Mark Dinning (title of a song from 1960)

Somewhat related to the above issue, the world is getting smaller (don’t think the irony is lost on me that a phrase we use to describe how fast the modern world is changing came from a song two decades before I was born).  Everything is so much more connected now, whether it be products (your car is connected to the internet which depends on satellites and under-water fiber optic cable) or countries (the components for your phone probably came from a dozen different countries).

All that interconnectivity is a good thing.  It means people/companies/nations can specialize in what they do best, allowing us to get the best products and services at the lowest prices.  But that connectivity also means that when the stone falls in the pond in one part of the world, the ripples hit everyone in some way, big or small.

Back in the day when the US economy was largely self-reliant, and even local economies were fairly independent, if crazy stuff happened across the world or even across the country, it didn’t affect things at home that much.  That impacts volatility because something is always going crazy somewhere.  And of course, that carries over to stocks which react to that craziness.  Gone are the days when General Mills was a regional foodstuffs provider for the Midwest; now its stock is affect by the Los Angeles longshoremen striking, the drought in sub-Sarahan Africa, and the revaluation of the Argentine peso.  Once again, more volatility.


This seems like a good stopping point.  We we’re almost done.  Come back tomorrow, same fox time, same fox blog, for the exciting conclusion to “What the hell is going on in the stock market?”

Two weeks into 2016 and already down 8%–OUCH

Dear Stocky,

Is anyone else besides me getting nervous about what’s happening in the stock market lately?  I always thought that the stock market did well in an election year but they’ve been going down.  I guess today things are a bit better.  But what do you think is going on?

I need to read some of your calming words again……

Mimi Ocelot


Here is an email that I got last Thursday.  The ironic thing is the market was up Thursday, but then crashed again on Friday, down about 2.5%.  So it’s understandable that Mimi Ocelot is nervous.


Also, for the sake of disclosure, Mimi is my mother-in-law, Foxy Lady’s mom.  Having known her for nearly 10 years, I can say she is definitely a nervous soul, but with the craziness going on in the market it’s understandable that even the heartiest of souls could be getting nervous.  Here is my take on the latest market gyrations.


“Just the facts” –Joe Friday, Dragnet


First, let’s look at the facts.  The thing about the stock market during election years is a bit of an old wives’ tale.  If you look back to 1950 (when the S&P 500 started), the returns during presidential election years averages about 7%, and the returns during other years averages about 9%.  So election years are a little worse, but they are both pretty good.  So this is another instance where people try to predict the market and they find they’re right about half the time and wrong about half the time.

Now let’s try to put these first two weeks of 2016 into perspective.  Stocks are down over 8% which is a pretty crazy steep fall over two weeks, but it’s not unprecedented.  Since 1950, there have been 17 two-week periods that had falls this bad or worse.  And of those 17 instances, 11 of them saw the stocks recover to their “pre-drop” levels a year later.  So that tells you most of the time you have these steep drops but the recovery is not that far off.

The other 6 times you ask?  One instance was during the 1987 market crash, and the other five were from the 2001 internet bubble or the 2008 financial crisis.  So maybe the recovery took a little longer, but not much.  After a couple years, stocks were hitting new highs.

So if you want encouraging words, I am definitely optimistic.  We’re going through a tough time, but nothing all that different from what happens every few of years.  Actually, the things that fundamentally affect the value of the stock market—a strong economy, innovation and scientific advancement, new products—all seem positive.  So I wouldn’t be worried.  Of course, Foxy Lady and I have a much longer time horizon that Mimi Ocelot so we can ride out a longer storm.  But things will be fine.

That said, there are some interesting market dynamics going on, especially lately.  I actually have a lot to say on this so I am going to break this up into a two-parter.  So tune in on Thursday to hear what I think is driving all this craziness.

Picking your investments for 2016

Decisions

The new year is a special time for me.  It’s a fresh start and a time of rebirth (even though it happens in the dead of winter).  You make resolutions, many of which you won’t keep, because this is the time to think about what you want to do before you get sucked into the rigmarole of actually doing it all.

For investing, it’s a natural time to reflect on your financial situation.  Am I saving enough to get where I want to go?  Am I investing that money in the places that make sense?  For this post I want to focus on the second question of where should you invest your money, and particularly should you change it from one year to the next.

Every year you have investments that do well and others that do poorly.  When you look on 2015 you’d see that international stocks (down about 4%) didn’t do nearly as well as US stocks (down about 0.2%).  Based on that what should you do?

One school of thought would be to invest more with US stocks.  If they did better last year, then it stands to reason that they’ll continue to do well since there probably hasn’t been a lot that has changed.  So stay with that winner.

The opposite school of thought is that the international stocks had a down year so they are probably “due” to do better.  Intellectually, I think this is the much more tempting strategy.  We know that stocks can’t continue incredible performance forever; eventually they will have an off year.  We also know that a well-diversified portfolio can’t continue to suck forever; eventually they will rebound (like stocks after 2008).


To answer this question with a little more analytic rigor I used my handy dandy computer and some free data from the internet.  Just to make things simple, let’s assume we live in a world with only two investments: US stocks (VTSMX) and international stocks (VGTSX).  As I mentioned, in 2015 US stocks did better than international.  So should we invest more in international?

Using data going back 19 years (that’s when the international index fund I am looking at started), the US fund has beaten the international fund 10 times.  That’s almost dead even—10 wins for US and 9 wins for international.

But the “wins” are very streaky.  US stocks performed better in 2015 as they did in 2014 and 2013.  On the other hand, International stocks outperformed US stocks for five years in a row starting in 2002.  Based on those snippets, you would have been worse off by switching your investments to last year’s underperformer.

If you look at all 19 years, there were 8 years when the lower performer from the previous year did better the next year.  Again, that’s about 50% of the time—8 years where the lower performer did better the next year, 10 years where the higher performer did better (it doesn’t add up to 19 because we don’t know which will do better in 2016).


Year

Investment that did better that year

Investment that did better the next year

2015

US

 
2014

US

US

2013

US

US

2012

Int

US

2011

US

Int

2010

US

US

2009

Int

US

2008

US

Int

2007

Int

US

2006

Int

Int

2005

Int

Int

2004

Int

Int

2003

Int

Int

2002

Int

Int

2001

US

Int

2000

US

US

1999

Int

US

1998

US

Int

1997

US

US


In a way the data is comforting, and it came out the way I predicted since I am a believer of efficient markets.  These theories on which stocks will do better tend to work about as often as it doesn’t.  Instead of spending a lot of time and effort trying to “figure out” which investment will do better, you’re probably best served just sitting tight.

The Fox family invests about equally between US and international stocks.  That means international stocks served us very well in the early 2000s but not so much the last couple years.  As far as next year goes, who knows?  I could tear the data apart and analyze it a million different ways, and I’d probably come out with something that said “doing it that way is better 50% of the time, and doing it the other way is better 50% of the time.”

So as the Fox’s take stock (pun intended) of our finances, we’ll continue plugging along with the same diversified investments we’ve used in the past.  Instead of trying to figure out which investment will do better this year, I’ll send that energy trying to figure out where Mini Fox hid the television remote.

Saying “I Do” impacts what Uncle Sam says he’ll take

discount-wedding-cake-toppers

Foxy Lady and I have been thinking about getting a divorce.  We don’t want to leave each other or be with someone else.  We still love each other, probably more now having been through 6 years of marriage and having brought two amazing cubs into the world, than when we were first married.  And let’s be honest: there’s no way I could do any better.  Foxy Lady is foxy, is an amazing mom, has a high-powered career, let’s me stay at home with the cubs.  She probably could do better, but don’t tell her that.

So we still want to remain fox and vixen, but just not in the official “married” sense.  What gives?  Since it’s a topic of this website, it probably has something to do with personal finance.  By being married we pay about $15,000 more in taxes than if we were living in sin as two single foxes.  Let me explain:

The federal tax code (and that of many states) is extremely complex and curiously set up.  It is meant to be progressive (wealthier people pay a higher percentage of their income in taxes), but in an attempt to achieve that goal, lawmakers have created a bit of a cluster that has some seriously screwed up features.  The “marriage penalty” is one of those.


Paying more if you’re married

Let’s look at two nearly identical couples: Mr and Mrs Leopard who are married, and Mr Tiger and Ms Lion who have been living together but never tied the knot.  Mr and Mrs Leopard each have good jobs and each make $100,000.  Similarly, Mr Tiger and Ms Lion each have good jobs and each make $100,000.

Mr and Mrs Leopard file jointly and owe taxes of $43,000 on their $200,000 income.  However, Mr Tiger and Ms Lion together owe taxes of $39,000 on their $200,000 income.  What the hell?!?!?!  Mr and Mrs Leopard are seriously pissed.  Mr Tiger and Ms Lion just paid for their annual family vacation Disneyworld.  Or better yet, they can use that money to fund an IRA and in 30 years they’ll have an extra $320,000, thanks solely to the fact that they never said “I do.”

That seems like a pretty big deal.  Being married or not has a 10% impact on the amount of taxes you pay.  How is that possible?  This is fundamentally an issue of figuring out who the IRS thinks is rich, remembering that we have a progressive tax code.

The IRS looks at two people with a combined income of $200,000 as being richer than one person making $100,000.  Maybe that makes sense.  The couple is probably pooling expenses like housing and the bills that go along with that.  A single person is bearing those housing expenses on her own.  That, in a nut shell, leads to the IRS taxing the $200,000 couple more than the $100,000 individual.

That’s all well and good until you have situations like Mr Tiger and Ms Lion.  The rationale that the expenses for two single people go out the window because they are really acting like they are married, sharing their living expenses just like Mr and Mrs Leopard.  When you choose filing status you can pick “Single” or “Married” but you can’t pick “Single but pretty much act like we’re Married.”  That’s the loophole.


Paying more if you’re Single

The opposite effect also occurs.  Imagine Ms Ocelot and her boyfriend Mr Panther.  Ms Ocelot has a high powered career where she’s making $200,000.  Mr Panther is a freeloader who watches TV and plays video games all day and occasionally writes on his blog which doesn’t generate any money.

Ms Ocelot pays $50,000 in taxes on her $200,000 income.  But if she made an honest man out of Mr Panther, their tax bill would fall to the same $43,000 that the Panthers pay.

That $7000 annual difference is just the same effect as above, but in reverse.  The IRS views a single person making $200,000 as being richer than a couple making that same amount.  Again, it kind of makes sense; that income is only supporting one person in the “single” example but two people in the “couple” example.


What it all means

“Stocky, what is the point you are trying to make?  Surely, you aren’t suggesting deciding on marrying someone based on the tax code.”  I kind of am.  Are you married because the state of Illinois or the US government says you are?  Not really.  You’re married because you love your partner, you want to take on life together with that person, you are committed to her until the end of your days.  That’s how it is for me.

If the government said there was a clerical error and our marriage certificate was never filed so I wasn’t actually married to Foxy Lady, I wouldn’t love her any less.  I wouldn’t be less committed to her and the two cubs we’ve brought into this world together.  Actually, I have a few friends, and maybe you do too, who are as committed to each other as any married couple, but they aren’t married in law.

But since the federal government says Foxy Lady and I are married, legally we MUST file as “Married” and that ultimately leads to us paying about $15,000 more in taxes than if we acted in the EXACT same way but just never signed that piece of paper six years ago.  And that’s serious money.  $15,000 in our case or $4000 in Mr and Mrs Leopard’s case or $7000 in Ms Ocelot’s case really adds up.  Over a life time, that could be a million dollars.


Marital advice from Stocky

So does Stocky endorses people who make similar incomes to not get married and couples where one person makes a lot more money to get married?  It seems severe, but why not?  This is one savings strategy that could pretty much fully fund your retirement.

Of course there’s the big caveat that you need to be in a very strong relationship.  One so strong that legally being “married” or “single” doesn’t impact the real-life state of your relationship.  If yours is at that level then seriously consider taking the free money the IRS is making available.

Yet, when I give that advice to people, recommending that they get divorced (but remain totally committed like they were married), they look at me like I’m crazy.  How could I even suggest touching the most sacred of unions for a few bucks.  Totally get it.  And to date, no one has followed my advice on this, so there you go.  But if your marriage is such that it can survive the US government saying your single, there could be some serious dollars in it for you.


You’ve ready my crazy theory on how to reduce your taxes.  What do you think?

Investment returns of home improvements

irobot-roomba-600-sideview

As many of you know, the Fox family moved from California to North Carolina when I quit my job and Foxy Lady got a great job with VF Corporation.  Part of moving is getting a new house, and part of getting a new house is fixing it up and updating it so it’s just the way you like it.

So often people look at home improvements as an “investment”.  And most of the time they misuse that word.  To me an investment is something where you pay money now with the expectation of getting that money back in the future plus a return on top of it.  Most home improvements aren’t investments at all; they are just expenses.  For example, painting the rooms in your house isn’t an investment.  You’ll never get that money back.  It’s not to say that you shouldn’t do it.  Maybe you’ll really the new look of the room and that will make it worth it.  But don’t say it’s an investment.

In fact, it’s pretty well accepted that almost every home improvement you do will give you a negative return.  Of course, that doesn’t mean you shouldn’t do it.  It’s just you should do it because you’ll enjoy your new kitchen or your three-season porch or your hot tub, not because you think that $10,000 you paid will increase the value of your house by $11,000.

All that said, there are a few home improvements that we’ve done, or are considering doing, that might make good investments in the “finance” meaning of the word:


CFL and LCD light bulbs

LED.BULB.A23-150W

In the past few years there has been a real revolution in light bulb technology as traditional incandescent bulbs have given way to newer, more energy efficient technology.  In our new house we had a lot (probably 60 or more) light bulbs in the house, all of which were the older, incandescent kind.  Would it be a good investment to change all those out for LED bulbs?

To do the calculation, you have to estimate how expensive electricity is (in North Carolina it is about $0.12 per kWh) and how much you use that bulb each day.  For a bulb you’re using a lot, that might be 4 hours a day or more.  Then you have to compare the cost of an LED bulb to a regular bulb.  In the past couple years prices for LED bulbs have come down precipitously (deflation); just a quick search on amazon.com shows that you can get an LED bulb for about $4 (with an expected life of about 18 years) and an incandescent bulb for about $1 (with an expected life of about 2 years).  Of course, the reason you would do that is beyond LED bulbs lasting a lot longer, they also use about 85% less electricity.  So it becomes a pretty simple calculation of does the longer life and electricity savings make the higher price of the bulb worth it?

This is a big, fat YES.  The calculations show that the investment return on an LED bulb is about 120%!!!!  So you’ll get that extra $3 you spent on the more expensive bulbs and then some, every year for the 18 year life of the bulb.  Friends, it doesn’t get better than this.  We live in a world where the stock market gives us 6-8% on average but with a ton of volatility.  This is a sure thing—basically a bond where you’re guaranteed to make money on your investment.


Roof-top solar panels

rooftop-solar-array-537x359

Back in California it seemed like everyone had solar panels.  Out in North Carolina, they are much rarer.  We have decided to become trend setters and install the panels on our roof.  Unlike the LED lights, where you could probably dig in your sofa cushions to find enough to pay for a light bulb, solar panels represent a huge up-front cost.

We’re looking into a 20-panel system that would generate about 4000 watts of electricity.  The all in cost would be about $18,000, but after you take into account tax credits, the cost ends up being about $14,000.  That’s a lot of money for sure, but you do get something pretty sweet, namely a lot of cost-free, pollution-free electricity.

When you look at our location, the pitch of our roof, the direction our roof faces, and all those other factors, those 20 panels would generate about 800 kWh per month.  That would be subtracted from the ~1200 or so kWh we use per month, and at about $0.12 per kWh, those panels would save use about $100 per month.

If you do the calculations, that ends up being a 5% return which isn’t great considering the risks of the panels breaking or the energy company changing the regulations to not be so generous or something else that I can’t even think of right now.  On the other hand, if you assume that the cost of electricity increases 5% per year, the return jumps to about 10% which is pretty decent.  And depending on your personal views regarding the environment, the return on your money may not be as important as reducing the need for about 10,000 kWh per year of coal-generated electricity (that’s about 7 tons of CO2 per year).

We’re still thinking about doing this or not, but I think we will.  But for this, the motivating factor is not the investment return (which is a “neutral” for me) but the environmental impact.


Vacuum robot

Foxy Lady and I got each other an iRobot vacuum for Christmas.  It cost about $400.  It’s a pretty cool little device but certainly not the Rosie the Robot that they might have you think.

rosie-robot-jetsons

We have found that it does a decent job in smaller areas, but you can’t really let it go and “clean the entire house”.  That said, we have two little cubs who create a concentrated mess in our kitchen/dining nook/living room area.  Seriously, Foxy Lady and I try to keep up and we’ve made the depressing comment on more than one occasion: “Didn’t you just vacuum in here?”  The area just seems perpetually dirty, particularly below where the cubs eat.

So we set the robot to do its thing every other day.  It does a decent job, certainly not as good as if a person was doing it, but that’s the beauty of it—it’s cleaning while you’re off doing something else.  So I’ll give it a solid B.

But how is it as an investment?  Not very good.  We have a cleaning person come in every two to four weeks to clean our house.  We pay that person $80, so if the vacuum robot saved us a trip or two, it might lead to a decent return.  But the truth is that the vacuum robot only does the floors, and really only that limited area.  We still need the cleaning person to actually mop the floors in the kitchen/dining nook/family room as well as vacuum and mop the rest of the house.  Plus there are all the other house cleaning activities (bathrooms, windows, counters, etc.).

So we use the cleaning person just as often with or without the vacuum robot, making the return 0%.  Life is definitely nicer when the floors aren’t totally gross, but that makes it a good purchase, not a good investment.


This blog is already starting to get long so I’ll stop here.  But I could also do this on our learning thermostat (low return), tankless hot water heater (low return), new television (surprisingly high return).  Please let me know if there are any other home improvements that you are thinking about and wondering what the return is.  In the meantime, replace all your incandescent lights with LED lights, and it will be the best investment you can make.

What to make of pensions

pension

Medtronic is such an amazing company, for so many reasons.  Beyond that whole “create amazing medical products that help people live healthier, fuller lives,” they offer some incredible financial benefits to their employees to help them build a comfortable financial future.

One benefit in particular is they give each employee and extra 5% of their pay which they set aside in a pension account.  When you leave the company, they give you that money either in a lump-sum or they will give you a pension for the rest of your life.  It’s an awesome benefit, but it involves a difficult choice: do you take the lump sum or do you take the pension?  Here is how I made that choice, and the different factors I took into account.


When I left Medtronic, my pension account had about $50,000 in it.  Medtronic could give me that in the form of a lump sum, or, based on my age (38 years old), they would give me a monthly pension of $220 until my death.  So which one did I pick?  Which one would you pick?


The case for taking the lump sum

  1. There’s something to be said for getting the cash all up front. Those monthly pension payments come only so long as Medtronic is able to pay them.  Right now they are an extremely strong company financially, but we’ve seen many times how strong companies can fall on hard times and lose their way.  This is especially true after major mergers (Time Warner with AOL, Boston Scientific with Guidant, etc.) and Medtronic did just merge with Covidien.  I have absolute faith that Medtronic will be able to pay me, but if you get the money up front, that’s one less thing to worry about.
  2. When you get the money, it is usually rolled over into an IRA so you don’t pay taxes on it (if you take it in actual cash, there are major penalties similar to if you cashed out your 401k). So you aren’t paying taxes on the money when you’re younger and you’re probably in a higher income bracket.
  3. The biggie is that you get to invest that money and then have it available when you turn 60. For me that’s a 22 year time horizon so I could invest it pretty aggressively in the stock market knowing that over that long of a time the probability is extremely high that the money will grow a lot.  Just using some basic assumptions, that $50,000 would probably be worth about $180,000 when I turn 60.


The case for taking the monthly pension

  1. You can use the monthly pension for today’s expenses. $220 isn’t a ton, but it’s still a nice chunk of change.  Just looking at our budget, that could pay for our internet, cable, and car insurance.  That’s not bad.  Basically I’ll have those “free” for the rest of my life.
  2. A pension is a nice way to diversify. As I mentioned here, most of our savings is in stocks which is appropriate given our ages and personal situation.  We have very little in bonds and other safer investments, so having a pension fills a little bit of a gap we have.
  3. When faced with the choice of taking a pension for $220 per month or getting a lump sum of $50,000, the pension is the better deal. If you shopped around for an annuity a 38-year-old male could get a $220 per month, and it would cost about $55,000.  So basically by picking the pension option from Medtronic I’m getting an extra 10% compared to what it would cost me to buy it in the open market.


There are good reasons to go either way.  Foxy Lady and I struggled with this a lot.  For us, it was a choice of going with your head (you’d choose the lump sum) or your heart (you’d choose the pension).

Financially, it’s a much better option going with the lump sum because you can invest it and let it grow.  When we’re 60 we could take all that money and buy an annuity worth $720 a month.  Given that Foxy Lady and I don’t need the income right now because she’s working and I’ve found a little bit of work on the side, it’s a better deal to take the bigger number when we do stop working.

But the heart wants what it wants.  There’s something comforting about getting a tiny income stream now that you know will always be there.  It’s not dependent upon the stock market or anything, and if everything did go to hell with the stock market in some catastrophic way, we would have this little bit.  Plus, as I mentioned earlier, we have a nice little nestegg right now but it’s all invested in stocks.  This provides a little bit of fixed-income diversification.  For these reason, we ultimately decided to go with the pension.

So there you go, a nice little primer on how to pick between a lump sum and a pension.  What do you think?  Would you have made the same choice?  If you’re with Medtronic, what are your thoughts on the matter?

Are you gambling or investing?

dice-scene-1-1


I’ve done a ton of posts on how over time stocks are a great investment, and I absolutely believe that.  However, like with all things, if you look at the extremes you start to see funny results.  Particularly, over the very short term, stocks aren’t really good investments at all.  In fact, if you “invest” in stocks and have a really short time horizon, you aren’t investing at all but rather you are gambling.  So investing or gambling, what’s the difference?  And when does stock ownership switch from gambling to investing?

As always, this is when I nerd out and get my handy dandy computer and free data from the internet and see what the numbers say.  Hopefully it’s not surprising that the longer you hold on to an investment, the lower the probability that you lose money.  But it is interesting how the numbers work out.

On any given day, there is a 46% chance that stocks will go down.  That’s not quite a flip of the coin (since stocks go up over the long run, you’d expect them to have more good days than bad), but that’s pretty darn close.  So let’s agree that if you’re investing for only a day, then you’re gambling.

Graph

Obviously, you can contrast that with the other end of the spectrum where historically there hasn’t been a 20 year period where you would have lost money.  0% chance of losing is not gambling, that’s clearly investing.

So where do you draw the line?  If you move from a day to a week, the chances of you losing money drop from 46% to 43%.  That’s a little better, but that still feels like a flip of the coin to me.  Go from a week to a month, and the chances of you losing money drop a little bit more, down to 40%.  It’s going in the direction that you would expect—probability of losing money drops the longer you hold on to the investment—but we’re still squarely in gambling territory.  If you do something and there’s a 40% chance of it coming out bad, I definitely don’t like those odds.

You can follow the table and see that at 5 years, the chances of you losing money on stocks is about 10% and at 10 years it’s at about 2%.  Clearly there is no right answer, and this is an opinion question so everyone is different, but I figure that somewhere between 5 and 10 years is when purchasing stocks ceases to be a gamble and starts being an investment.


Recreational investing

One of the things I try to do with this blog is help people better understand the stock market and how it behaves by looking at historic data.  I think this is a good example.

As I said at the start, the stock market is a great place to build wealth but you have to be smart about it and you have to have your eyes wide open.  If you’re investing just for a month or a week or a day, just understand that what you’re doing looks a lot less like investing and a lot more like gambling.  If that’s what you want to do that’s great.  Just be honest with yourself.

This brings me to an interesting topic which is “recreational investing”.  A lot of people come up to me and say they understand that slow and steady, and index mutual funds, and a long-term view are probably the best way to build wealth.  But it’s boring (a sentiment I totally agree with), and they want to keep a small portion of their money so they can “play,” investing in particular stocks they like, similar to the way someone would pick a horse at the track or play the table games in Vegas.  To this I say: “go for it”.

Life is too short, and that stuff can be really fun.  If it’s fun for you to “play the market” and gamble on some stocks, rock on.  Just know that you’re gambling and not investing.  But I’ll tell you, if you have a gambling bug, I’d much rather do it with stocks than blackjack or the ponies.  With stocks, as we saw above, even over a short time frame, you have the “house advantage”.  With other types of gambling, the house has the edge.  So I totally support recreational investing if that’s what you’re in to.


What do you think?  At what point does buying stocks change from gambling to investing?  I’d love to hear.

What a crazy week on Wall Street

“The more things change, the more they stay the same”  –Jean-Baptiste Alphonse Karr

Stocks have taken a really wild ride lately.  Starting last Thursday, they had a free fall down 10%, then they recovered about 6% of that.  Things finally settled down on Friday when the market finished virtually unchanged.

SP500 graph

There was actually a streak of 6 days where stocks moved at least 1%.  Generally speaking a 1% move is pretty big (in this market it’s about 170 points on the Dow).  To have that happen 6 days in a row seemed pretty extraordinary.  More than the steep drops, I think it was the relentless “huge” moves everyday that particularly put my nerves on edge.  I think I can better handle just a crazy day and then accept that it’s over.  Kind of like an earthquake in Southern California; it’s violent and scary, but it just lasts a couple seconds, then it’s over and you know you need to start getting on the business of recovery.

So I wanted to ask two questions:


How often does the market move 1% for so many days in a row?

Before this streak of 6 days in a row, the next longest streak in 2015 was for 3 days.  The longest streak in 2014 was 5 days, the longest streak in 2013 was only 3 days, and the longest streak in 2012 was 2 days.  So that starts to tell me that a 6 day streak is not all that common.

In fact, you have to go back to 2009 and the aftermath of the Great Recession to have a streak of 6 days.  However, that was the tip of the iceberg.  During that time there was also a streak of 8 days, another of 7 days, and two separate streaks of 10 days in a row where the market moved at least 1%.

I think that puts what we just went through in perspective, both for the good and the bad.  First, what we went through was a pretty big deal. Crazy weeks like that don’t really happen all that often, and you survived it so congratulate yourself.

That said, compared to the Great Recession, this was just a small blip.  And that feels right.  During the depths of the Great Recession, people were actively questioning the viability of capitalism and the stock market, and there was a real sense of capitulation.  Those days have left deep scars for many, a lot of whom have sworn off stocks just because that was such a tough time for investors.

I never felt anything close to that during this roller coaster.  When things were falling, sure it sucked, but I sensed that most people were looking at it as a blip that would prove a good buying opportunity (as turned out to be the case).  Sure, it was frustrating when we finished one bad day and then follow that up with another bad day, but again it never seemed people were losing faith.

Put all that together, and I’ll call this a class 2 hurricane.  It caused damage and but no lives were lost.  We’ll forget this in a few months.  That’s very different from a class 4 hurricane (Great Recession) or class 5 (Great Depression).


Has the market gotten more volatile in recent years?

The other thing that occurred to me was is all this market volatility increasing.  You hear people talking all the time about how the market is changing, typically for the worse.  I don’t buy a lot of those arguments, but I do believe that the market is changing in undeniable ways—computers are driving more trades, investing is becoming an international game, investors are getting savvier, information travels much more quickly, and you could go on and on.

I pulled data on the S&P 500 going back to 1950 when the index began.  I counted the number of days where the market moved at least 1%, and I was fairly surprised by the results:

Up 1%

Down 1%

2010s*

12%

11%

2000s

16%

17%

1990s

11%

9%

1980s

13%

11%

1970s

10%

10%

1960s

4%

5%

1950s

7%

6%


Looking at the data a few things stand out.  First, there seemed to be a big change around 1970.  Before that about 10-13% of the trading days had big moves.  But since the 1970s, those days jumped up drastically to at least 20%.  I tried to think what would have caused this stark change and I couldn’t come up with anything.  Sure, the world has changed drastically since the 1950s, but was the change from the 1960s to the 1970s any greater than, let’s say, the 1990s to the 2000s?  I don’t think so, but something happened.  The data’s definitely there.

Second, the 2000s were the most volatile decade in this data set.  If you look back then, that makes sense.  The decade was bookended by two disastrous periods for investors—the tech bubble popping in 2000 and the Great Recession in 2008.  Both periods put stocks in an absolute frenzy, diving one day then freighting a recovery the next.  I’m not old enough to have lived through the Great Depression or the lost decade of the 1970s, but I did feel I cut my teeth in the 2000s.  I suppose in a perverse way, it’s comforting to know how crazy of a time that decade proved to be.

Finally, and most topical, is that the 2010s, so far are a pretty average decade as far as volatility goes.  Sure you had the past week and a half which was a whirlwind, but as we saw at the top of this post, the previous years were pretty calm.  This decade compares pretty favorably to the 1990s, 1980s, and 1970s.

I think it’s important to put this in perspective and somewhat debunk all the doomsdayers who tell us that things are so different.  The opening quote, “the more things change, the more they stay the same,” which to further prove it’s point was first coined in the early 1800s, seems to prove its wisdom.  Sure we can get caught up in all the craziness of the past few days, and that’s okay.  But let’s not lose sight of the fact that this is just the way the stock market is and has been for a very long time.


* 2010s are through 28-Aug-2015.

Fun times with the Federal Reserve

federal_reserve_logo_2147

Nothing gets stock markets so excited as the Federal Reserve.  The United States’ central bank, with a couple well chosen words, can send markets up or down hundreds of points in a matter of minutes.  It’s even entered the investing vernacular as “Fed Watching”.  Alan Greenspan and Ben Bernanke and Janet Yellen have become household names.  But why is the Fed so important?  What is it doing that sends the markets into such frenzies?

Basically (and this is very basic, as there is a boatload of nuisance in this) the Federal Reserve, and for that matter the central banks of any country, control the core interest rate.  That single, yet enormously powerful tool, allows the fed to influence the economy in a major way.

The guiding mission of the Fed is first and foremost to maintain a healthy level of inflation.  In the US that is around 2-3%.  Being too low has some problems that reasonable people can debate, but pretty much everyone believes that when inflation gets too high, that’s when really bad things happen.  So more than anything, the Fed is tasked with keeping inflation low.  Then a secondary goal is to promote a healthy and growing economy that keeps unemployment low.  So basically the Fed has two jobs, keep inflation low and keep the economy strong.


How does the Fed impact the economy?

Let’s imagine a really simple economy.  There are ten companies named A and B and C all the way down to J.  Just like in real-life, not all companies are created equal, with some being much more profitable than others.  Here A is the most profitable (maybe like Apple) while J is the least profitable (maybe like JC Penney).

Interest rates will play a big part in the profitability of these firms.  As interest rates go up, the amount they spend on interest for all their debt goes up as well.  Because A is so profitable, it would only start to lose money if interest rates went really high, up over 10%; however J is much more vulnerable and will become unprofitable if interest rates go over 1%.  All the other companies have a similar situation as shown in the graph.

Capture

So this is where the Fed comes in.  Let’s say the Fed sets the interest rate at 6%.  Firms A, B, C, D, and E are all profitable even when the interest rates are that high; but firms F, G, H, I, and J are not.  Because of that things won’t look good for firms F-J.  Maybe it’ll be so bad that they’ll go bankrupt or maybe they’ll lay off people or put a hiring freeze on.

At 6% interest, you have five firms that are doing well (A-E)—growing, hiring more people, expanding, etc.—and five that aren’t (F-J).  And at 6% the economy is performing at a certain level.  But what would happen if the Fed lowered the interest rate from 6% down to 5%?  One more firm (F) would be profitable, and in general it would benefit all the firms.  The profitable ones would be doing even better, and the unprofitable ones wouldn’t be quite so bad off.  And that would lead to a strong economy: more “stuff” would be produced and more people would be employed.

So there is very clear relationship that lower interest rates led to a stronger economy.  Having a strong economy is one of the Fed’s goals, so that begs the question, “Why doesn’t the Fed push rates all the way down to 0%?”

This is where it starts to get interesting.  It’s my favorite topic: Inflation.  Remember that the Fed’s first job is to control inflation.  Let’s look at the Fed’s decision to move interest rates from 6% to 5%, but now look at it with an eye towards inflation.

In our pretend world, let’s assume at 6% interest rates the economy is doing well.  Things are growing and unemployment is fairly low.  When interest rates go to 5%, firm F will become profitable so they’ll want to hire some people—makes sense.  But remember that unemployment is low, so F is going to need to tempt people who are already working for A or B or C or who ever to come work at F.  How does F do that?  They pay them more.

F starts to pay people more, but A doesn’t take this lying down, so A starts paying more.  This wage increase trickles through the economy.  But A and B and even F need to make money, so the increase in compensation they’re paying to their employees gets passed along to consumers in the form of higher prices.  When prices start rising, that’s INFLATION.  And controlling inflation is the Fed’s #1 goal.  So that creates the difficult balance for the Fed—they want the economy to do well but not so well that it triggers inflation.

So there you go.  You just completed a course in “Introductory Macroeconomics”.


What’s going on today?

Now that you have that little lesson under your belt, how does that relate to what’s going on with the Fed right now?  Currently, the Fed has interest rates at historic lows, at about 0%.  Obviously that’s super low, so shouldn’t the Fed be worried about inflation?

Remember the circumstances of how interest rates got that low.  At the beginning of 2008 the economy was going strong and the interest rate was at over 5%.  But then the financial crisis hit, blowing up the banking industry, and sending the world economy into a very sharp recession.  A ton of people lost their jobs (unemployment went up) so prices stayed flat or even started to fall a little bit.

With all this going on, the Fed threw a life raft to the economy in the form of near 0% interest rates.  In the intervening years, the economy has rebounded and unemployment has fallen, but inflation has remained pleasantly low.  This is kind of the best of both worlds for the Fed—the economy is strong and there’s no inflation.  The two things they have to balance are both in happyland, so they have kept interest rates low.

But what keeps them in the news is “the specter of inflation on the horizon.”  If you follow this stuff (like I do) in the past few months, every time inflation numbers come out, everyone looks at those and tries to predict what the Fed will do.  Earlier in the year when it looked like inflation was picking up, everyone thought and the Fed confirmed that it would probably start to raise rates.  However, in recent months, inflation has reversed and stayed low, allowing the Fed to keep rates low.  This is the drama that has been playing out for the past 6 months.

Every time this happens the market swings like a pendulum.  If rates are going to go up, the stock market gets crushed because firms will be less profitable (as we saw in the lesson above).  If that changes and we think rates are going to stay low, the market shoots up like a rocket.


What does it really mean when the Fed changes interest rates?

With all of this, are we just a bunch of idiots?  Should we really be so happy if the Fed is keeping rates low, and should we be so bummed if the Fed raises rates?

As the parent of two boys who one day may start sponging off Foxy Lady and me, I think the parent-child relationship is a good analogy.

Imagine you have parents (the Fed) who have a grown child (the US economy).  Times are tough for the child (the economy is doing poorly) so the parents help out (the Fed lowers interest rates).  The good scenario is that the child starts doing better to the point where he doesn’t need his parents’ help (the economy strengthens so it can withstand higher interest rates).  The bad scenario is the child becomes dependent on his parents’ help and is never able to make it on his own.

In this analogy the parents reducing the amount of help they give (the Fed raising rates) is a good thing, isn’t it?  It means that the kid is getting things on track and is standing on his two feet.  For this reason, I actually think it’s a good thing if the Fed raises interest rates because it means that the economy is strong enough that it doesn’t need insanely low interest rates any more.  Yet the markets react in the exact opposite direction.

I get it.  Just as the kid would be bummed if the parents said, “hey pal, since you’re starting to make some money now, we won’t be sending those monthly checks”, the companies are bummed that they can’t borrow money so cheaply.  But that isn’t sustainable.

I chalk this up to yet another of a million examples of how the stock market acts in a goofy manner in the short term.  And another reason why I NEVER try to time the market.  I just keep my head down and invest for the long term, regardless of what is going on with interest rates.  But watching everyone hang on Janet Yellen’s every last word does make for perverse entertainment.


As the current debate unfolds, what do you think?  Is the economy strong enough for the Fed to take away the credit card?


Picking when to take Social Security

Social-Security-SSA

In the United States, Social Security is an important part of most peoples’ retirements, actually probably too important in many instances.  Social Security is a fairly simple program that was designed to be pretty idiot-proof.  You don’t really need to make many decisions for it, which contrasts sharply with all the decisions you need to make on your other investments (like tax strategies, asset allocation, picking investments, etc.).

With Social Security, you just work and the government takes its 12.4% (6.2% from you and 6.2% from your employer) of your compensation.  In fact, you don’t really have a choice in the matter and the government does it automatically.  Then when you get old, the government gives you a monthly pension.  Not real complicated on your end.

However, there is one really important decision you need to make regarding Social Security: when you start taking it.  Basically, you have three options: 1) Early retirement-when you turn 62; 2) Regular retirement-when you turn 67 for most of us; 3) Late retirement-when you turn 70.  And as you would expect, if you start taking Social Security later, you get a larger monthly check from the government.

This is obviously an important choice to make, and it’s one that gets a lot of press coverage with all sorts of people opining on what to do (I guess with this post, I am adding my opines to those ranks).  Generally speaking, the advice slants towards taking it later.  Yet, I wonder if that’s really good advice.  Using my handy-dandy computer, let’s go to the numbers to see what they tell us.


I checked my Social Security statement and I’ll be able to pick from one of the three choices:

Age to start taking Social Security

Monthly check

Early retirement—age 62

$1800

Full retirement—age 67

$2600

Delayed retirement—age 70

$3200


As you would expect, the answer to this riddle is a morbid one.  When do you expect to die?  The longer you live, the more it makes sense to delay taking Social Security so you can get the bigger check.  That’s not a tremendous insight, but when you do the math, you start to see some interesting things going on.  I fully appreciate that Social Security is very nuanced and complex, so I am just covering the simple basics here.

In my analysis to be able to compare the different scenarios, I assumed that I saved all the Social Security checks and was able to invest them at 4%, about the historic rate for a bond.  If you do that the table above expands to this:

Age to start taking Social Security

Monthly check

Highest value

Early retirement—age 62

$1800

Die before age 79

Full retirement—age 67

$2600

Die between age 80 and 84

Delayed retirement—age 70

$3200

Die after age 85


Capture

That’s pretty profound actually.  The average life expectancy in the United States is 76 for men and 81 for women.  Doesn’t that mean that most of us should be taking Social Security with the early option?  That contradicts most of the advice out there on this topic.  That, ladies and gentlemen, is why Stocky is here for you.  This is where it starts to get fun, and we can apply a little game theory (awesome!!!).


When to start Social Security?

Actually, once you reach age 62, the life expectancy of those still alive (and able to make the decision on Social Security) is 82 for men and 85 for women.  This makes sense because you’ve survived to 62 so by definition you didn’t die before then (awesome insight, Stocky), and those early deaths pull down that initial life expectancy model.

Since women are better than men as a general rule (Foxy Lady took over typing for just a second there), let’s look at this decision as a 62 year-old-woman.  She needs to make a decision on when to take Social Security.  She knows her life expectancy at this point is 85, which means there’s about a 50% chance she makes it to 85.  So the worst choice for a 62 year-old is to take the early retirement option.  She’s probably going to live long enough that either full retirement or delayed retirement is the better option.

At 62 she does the smart thing, and decides to wait.  Her next decision comes at age 67, assuming she lives that long (there’s about a 5% chance she’ll die during those five years).  But a similar thing happens—when she was 62 her life expectancy was 85 (right on the border of picking between full retirement and delayed retirement), but now that she’s 67 her life expectancy jumps up a year to 86.  So if she makes it to 67 then she’s better off taking the delayed retirement (of course, there’s about a 4% chance she’ll die before she makes it to 70).

That’s a little bit weird though, isn’t it?  It kind of feels like you’re that horse with a carrot dangling over his head, keeping him walking forward.  It’s a bit of a conundrum.  At any given time, you’re better off delaying starting your Social Security, so the math tells you to keep waiting and waiting.  But if the dice come up snake eyes and you die, then you miss out on everything (not strictly true, but true enough for our analysis).

And keep in mind that since Foxy Lady hijacked Stocky’s computer, we’ve done this analysis for women.  The math tells you that it’s just about a wash between taking Social Security at 67 or 70.  Since women live on average 3 years longer, for men you would think it means that the advantage leans towards taking it early.


What does it really matter?

So the analysis tells us that we’re better off waiting if you’re a woman and it’s really close if you’re a man.  And of course the longer we wait, the further we come out ahead by taking delayed retirement instead of early or full retirement.  But how big of numbers are we talking?

Remember, the cut off for when full retirement becomes better is at about 80 years old.  The cut off for when delayed retirement becomes better is about 85 years old.

Future value of Social Security payments

Age

Early retirement (62)

Full retirement (67)

Delayed retirement (70)

85

$1,031,256

$1,119,603

$1,125,233

90

$1,450,231

$1,644,630

$1,716,663

100

$2,647,751

$3,158,200

$3,431,844


Those are meaningful differences.  If you make it to 100 years old, delayed retirement comes out about $800,000 higher than early retirement.  However, those are in future dollars, 38 years into the future if you’re 62 today and faced with this decision.  That $800,000 when you’re 100 would be worth about $370,000 today.  Of course that’s if you make it to 100, which isn’t really likely (about a 3% chance).

If you make it to 90 years old (you have less than a 30% chance) then the difference is about $260,000 in future dollars which is about $150,000 today.


Wrapping up, I’m really torn on this.  There’s a little bit of a prisoner’s dilemma type thing working that keeps making you want to push back when you start collecting.  And then when you look at the upside of delaying retirement, the numbers are pretty big (whenever you’re talking about hundreds of thousands of dollars, that’s real money), but the chances of us making it to that super-golden age are pretty small.

I suppose it’s best to wait, but I’m giving that a pretty “luke-warm” endorsement.  Actually, I think the way the Social Security administration sets it up, the options are all pretty similar.  We all have this personal belief that we’ll live longer than average (but not everyone can live longer than average, expect if you’re from Lake Wobegon, MN).  And that makes us think we’re better off waiting, but it probably is all pretty equal.