Will you lose money with stocks?

I’m trying to build my audience, so if you like this post, please share it on social media using the buttons right above.

This is probably the most common question you get from people who are considering starting to invest in stocks.  It’s pretty understandable; you work hard for your money and the idea of it disappearing into the black hole of an unpredictable and often times not-well-understood stock market is pretty hard to stomach.  Add on that scars from the 2008 Great Recession, 2001 Internet Bubble, Black Monday in 1987, Black Tuesday in 1929, and on and on and on.  Even recently, 2018 has had a bunch of wild freefalls, including the one we’re in right now.

So, what’s the answer to the question:  Who knows?  The stock market is unpredictable and no one knows what will happen in the future.  That’s not an especially satisfying answer, but it’s the truth.  If I could predict the stock market I would own my own island in the Caribbean next to Johnny Depp’s.

But I can hear you saying, “Come on, you’re Stocky Fox.  You can do better than that.”  You’re right.  I’m taking on the challenge and answering the question: Will you lose money with the stock market?

I won’t try to predict what will happen in the future, but I think you can look to how things have behaved in the past, and get a pretty good perspective.  Of course, there’s no certainty that the future will be like the past, but that’s the best we have to look at.

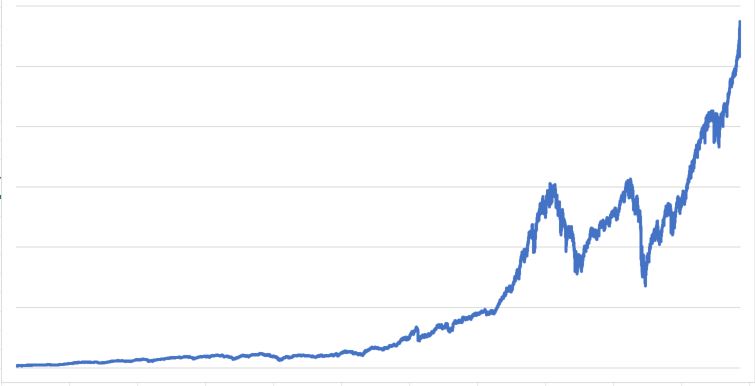
You can get somewhat decent data on the stock market going all the way back to 1871.  Back then, your great-great-great grandmother was getting The Stocky Fox as a newsletter delivered by the Pony Express.  Going that far back, you can calculate the percentage of the time that you would have lost money investing, historically.

So imagine starting in January 1871 and investing $10 every month in the US stock market.  By January 1872, you would have invested a total of $120 and your stocks would be worth $128; congratulations, you just made a profit.  You can do that for every 12-month period since 1871 (there are about 1700 such periods), and you come out ahead 71% of the time, which seems pretty good.  But the flip side is that you’d have lost money 29% of the time, and at least to me that is too high to be really comfortable.

Chart for losing money

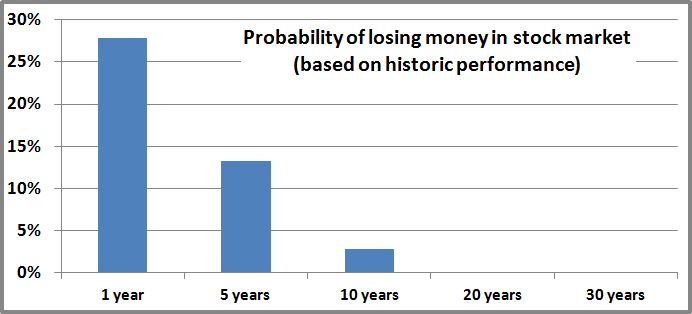
However, remember that when investing stocks, time is on your side.  Do the same exercise but for five years; if you started in January 1871 after 5 years you would have invested a total of $600 which would be worth $679 in January 1876 (yeah, profit again!!!).  Do that for every five-year time period and you end up losing money only 13% of the time.  By adding another four years to your investing time horizon that decreased the chances that you would have lost money by 20%!!! That seems pretty amazing.

You can keep doing that for longer time periods, and as you could guess, the percentage of times you would have lost money keeps going down.  Astoundingly at the 20-year mark, you would have lost money only one time out of the nearly 1500 periods possible (the one month was June 1912 which, you guessed it, was 20 years before the Great Depression bottomed out).  At 30 years, there isn’t a single time period where consistent investing would have lost money!!!  That’s not a misprint.  Read that paragraph again.

There are no guarantees, but if you use history as a guide, it’s pretty much a sure thing that you’ll make money in the stock market.  Certainly it involves a lot of discipline, investing month after month no matter how bad things look (dollar cost averaging).  Also, it doesn’t necessarily mean you always make a lot of money, but the data seem pretty powerful.  Additionally, I didn’t take inflation into account so that would definitely skew the numbers downward (but you know how I feel about the integrity of the data on inflation, so there you go), but the message remains largely unchanged.

I must confess that I was a bit surprised by the data.  Actually, I spent about 30 minutes going through the spreadsheet to see if I made any mistakes; I’m pretty confident the analysis is sound.  As Dr Brown asked Marty in Back to the Future, “Do you know what this means?” (just don’t take what he says after that and apply it to my analysis).  If your time horizon is 20 years or more, at least based on history, there’s virtually no chance that you’ll lose money.  I figured it would be a pretty low chance, but zero chance?  I didn’t see that coming.  Even people who invested for 20 years then pulled out after the Great Recession in 2008 did fairly well (invested $240 which became worth $339).

So there you go.  My answer to the question posed at the top is still: No one knows what the future holds.  But the historic data confirms my personal belief that the stock market is a really great place to invest your money.  I lose no sleep worrying about the Fox family’s investments increasing in value.  I know over the long term they will.

My story about selling commodities

A few years ago, I wrote about our worst investment of all time—commodities.

I think this is a classic case of deviating from the tried and true rules that you only need three investments in an effort to get creative and get higher returns.  In general you should always resist that siren song.  It cost us well over $100,000; that’s an expensive lesson.

After a few years of crapping performance, I finally bit the bullet, admitted defeat, took a huge loss, and sold my commodities.


Examining the wreckage

We starting buying commodities ETFs (ticker symbol DJP) in 2010 in small increments, and continued that through the end of 2014.  When all was said and done, we had invested a total of about $100,000.  By the time we sold, those ETFs were worth about $65,000, so we lost $35,000.  Ouch!!!

But that’s only a small part of the loss.  I knew, I KNEW, that we should invest that money in stocks but we didn’t.  Had we invested that money in a stock index fund that $100,000 would have grown to nearly $200,000 by the end of 2017.  I just threw up in my mouth.

A picture says a thousand words–the purple line is commodities for the period we owned them; the blue line is US stocks. OUCH!!!


This is a boneheaded mistake for the ages.  Of course, as in most things in life, when you realize you made a mistake like that you need to move on.  With stocks that’s tough psychologically to do because not only is it admitting failure, but it’s also locking in those losses.  So long as you keep the investment you can always tell yourself there’s a chance that things will turn around.

Finally at the end of 2017, to take advantage of a little tax loss harvesting, I sold all our commodities investments.  That horrendous chapter of our investing history was over.


Investing gods decide to humble me further

What unfolded was a story similar to one of those stories from the Bible where God continues to test someone’s faith.  I sold all our commodities investments and invested them in US stock investments.

By the end of April 2018 commodities were up about 2% for the year while stocks were down 2%.  ARE YOU KIDDING ME?  After 7 years of stocks drastically outperforming commodities, the trend reversed right after I sold out my commodities.  As you might guess, I was feeling picked on by some power beyond my understanding.

I kept to my guns and my faith was rewarded.  By the end of August 2018, stocks had a big rally (up 8% for the year) while commodities were crushed (down 7% for the year).  When all is said and done, stocks are up about 2% while commodities are down 5%.  That difference equates to about $4000 in my favor.


There are a couple things I took away from this:

First, as an investor, you have to focus on the present and future, and not cling to the past.  Second, sometimes your investments work out and sometimes they don’t, and you can’t get paralyzed by your investing failures.  Third, exotic investments generally don’t work out over time.

All these really combine to illustrate all the things I did wrong with commodities.  I should have just stuck to investing in stocks as I always preach on this blog.  Once it started going bad, I should have cut and run instead of clinging to something in the hope that it would “come around.”

Better late than never.  While I definitely left over $100,000 on the table, at least I didn’t leave that last $4000.  That’s what I tell myself anyway.

Top 5 investing highlights from 2018

We’re all getting used to me going for extended periods without writing a blog post.  I’m sorry about that, but I’ve had a consulting job for the past couple months that has been keeping me busy.  It’s starting to wind down, so I should have more time to consistently write posts.  As always, thank you for sticking with me.


Wow!!!  It’s been a crazy few months in the stock market since I’ve been gone.  I figured for my first blog back I would give you my list of the craziest/most interesting things to happen in the investing world the past few months.  Some of these deserve their own post, so we can dive deeper into those in future posts.

Without further adieu, here are my Top 5 investing highlights since April:


5. Interest rates on the rise: 2018 has been the year of the interest rate increase by the Fed. In response to the 2008 financial crisis, the Fed cut interest rates to nearly 0%.  There they stayed for nearly the entire 8 years of the Obama administration.  It was only in December of 2015 that the interest rate was raised to 0.5%.

Since 2015, there have been 7 rate increases (including 3 so far in 2018), bringing the Fed rate to 2.25%.  This stuff makes finance nerds giddy, but it does have real-life impacts on the rest of us.

I think the biggest direct impact is that mortgage rates have started to go up.  Now a 30-year fixed mortgage is at about 5%.  A couple years back it was at 3.5%.  That’s a major change that could mean hundreds of dollars per month on a families mortgage.  This impact stretches to housing affordability (gets worse) and number of families refinancing (goes down).


4. Massive tax law passes: I know the big tax law passed in December 2017, but I feel a lot of the ramifications hit in 2018. By mid-year it seemed the impact was starting to hit the market—GDP growth was higher than it had been in a really long time, unemployment was lower, and because of the low unemployment inflation had kicked higher.

The immediate impact of the tax break had a major boost to the markets in late December and early January.  Then there was a huge market drop in late January and early February.  However, it seemed that the benefits of the tax breaks (higher GDP, lower unemployment) started boosting stock, with the US markets hitting all-time highs in September.

Obviously, since September stocks have been on a major slide, but we’ll leave that for reason #1.


3. US elections in November: Politics are different from investing, but obviously they are connected. The soap opera that is Washington DC hit a fever pitch on November 6, with an unusually high amount of drama for a off-election.

Republicans increased their majority in the Senate, while Democrats gained enough seats in the House of Representatives to take over that chamber of Congress.  The headline was obviously that the US would have a split government for the next two years.

Pundits spent innumerable hours debating the impact split government would have on the nation broadly and the investing markets in particular.  The common thinking is that split government is a good thing in that government can’t make major changes, giving some level of predictability for business.  I tend to agree with that.  In fact, when you look at the data, the stock market does best with a split government.

In case you were curious, the market was up 2.1% the day after the elections, so clearly the markets liked the outcome of the election.


2. America is #1: I had a blog on this a while back, but I’m still fascinated by this phenomenon. As of now, US stocks are down 2.2% for the year while international stocks are down 14.2%.  That’s a 12% difference!!!  That’s huge!!!

Curiously, they stayed fairly coorelated all the way through April.  Then, starting in May, they really began to diverge.

The reasons aren’t entirely known.  Many people have many opinions, and I imagine this will be examined for years.  However, my belief is it’s a combination of the US winning the trade wars, China’s economy slowing down, and Europe figuring out Brexit and the future of the EU.

Who knows if I’m right or wrong.  But certainly this is interesting.


1. The rollercoaster that is the stock market: It has been a wild ride all of 2018.

January started out on fire, then the stock market took a huge dump in February, rallied towards the end of the month, fell again in March, then plodded out a 8-month upward march that peaked in September, and has since fallen to its current levels.

Those a 6 distinct moves, all of which are major.  I’ve talked about how I think volatility is becoming more inherent in the market, so I think that’s a piece of it.  But the change of directions this dramatic is definitely an unusual twist.

And we still have a month to go.  Stay tuned.

Market dips are awesome?!?!

Holy crap!!!  The last week of the market has been insane.  We’ve seen the largest point drops in the history of the Dow—1175 drop on Monday and 1033 drop on Thursday, although neither ranked within the worst 50 drops in percentage terms.  This is crazy, yet why would I possibly think that this is a good thing?  Over the past 6 trading days, the market is down about 7%.  Yowza!!!

I am, and most of you are, long term investors.  The money I am investing in the stock market is meant to be spent years, or more likely decades, from now.  Sure, what happened right now sucks and maybe is scary (although I think it’s actually the opposite).  That should be comforting because, although we’ve taken a huge body blow, the good news is that we have a really long time to recover.


Dollar cost averaging

OK, that might explain why it’s not so bad, but how could it possibly be good?  If you can take a Pepto and keep your head, this is actually a great time to be investing, be it regular contributions to your 401k and IRA or just regular stock purchases.  If you were excited to buy stocks two weeks ago when the market was frothing, you should be even more so now that stocks are “on sale” at 7% off.

Sure, that might make sense philosophically, but how does that work in real life.  Let’s look at my nephews Risky Fox and Safey Fox.  Risky Fox invests $10 every day no matter what happens.  His twin Safey Fox cut a deal with the investing gods where every day the stock market goes up an equal amount.  Both twins started investing on January 1, 2000, and each has invested $10 every day for those 18 years.  They both start when the S&P 500 was at 1455 at the start of the millennium and they both end last Friday when the market was at 2,620.

Those 18 years have had crazy bull markets and crazy crashes—the dot-com bubble and it’s popping in 2001, the Great Recession of 2008, and the Trump run of 2017.  Those are the big ones but there have been mini-crashes and corrections too like August 2011 and January 2016.

Through all of that Risky invested $10 through thick and thin, no matter where the market was, high or low.  In her bizzaro alternative universe, Safey invested $10 every day , knowing each day the market went up a small but consistent amount (0.0129% each day if you’re curious).

Who ends up ahead?  It would be a pretty stupid column if it was Safey . . . of course it was Risky Fox.  Each invested $45,560 over those 18 years.  Safey ends up with $62,011 which isn’t bad.  But Risky ends up with $89,773, about 45% more.

How does such a thing happen?  In 2001 the dot-com bubble popped and stocks fell 45% over three years.  Throughout all that Risky kept plugging away, investing his $10 each day, but now he was getting stocks at a huge discount.  Stocks recovered after a few years and that looked like a great buying opportunity in hindsight.  Then in 2008 the Great Recession his and stocks fell about 55% in a little over one year.  Again, Stocky keeps investing and when stocks bounce back, he looks like a genius for having kept faith and picking up stocks at a substantial discount the whole time.

And just to prove it isn’t a unique thing, if you did the same Risky/Safey experiment for the 1970s, 1980s, and 1990s, you get similar results.  The 1960s and 1950s have Safey coming out ahead, but by a much smaller amount.


Risky

Safey

Difference

2000 to 2018

$89,733

$62,011

45%

1990s

$69,324

$56,044

24%

1980s

$51,181

$48,492

6%

1970s

$28,650

$27,538

4%

1960s

$29,951

$31,100

-4%

1950s

$48,480

$50,926

-5%


And never lose sight of the fact that what Safey is doing is impossible.  The market doesn’t work like this.  This just shows that what Risky is doing, something we all “have” to do, really isn’t all that bad.

It’s similar to asking if you can get from point A to point B faster by walking with your feet or flying with your wings.  You can get there with your feet most of the time more quickly, but even if that wasn’t so, none of us have wings.  The whole point is that buying through market down turns (or walking with your feet) does pretty well, even when compared to some fantasy construct.


Faith

Ultimately, this is a lesson of faith.  When we were in the depths of the Great Recession, Warren Buffet famously professed his faith in the US economy.  He turned out to be right and made tens billions (billions with a “B”) along the way.

There’s no proof that markets will always go up (predicting the future of human behavior is always impossible), and at the end of the day it’s a matter of faith.  If you believe in capitalism then you believe that stocks will always go up.  I do believe in capitalism so I do believe that stocks will always go up.

That’s what makes the little experiment with Risky and Safey work.  Even when things look horrible, like it did in the dot-com bust and the Great Recession, if you have faith in capitalism you’ll look at the downturn as a temporary turn that will ultimately return to rising prices.  You can see this by looking at a long term stock chart of US stocks: they have an unrelenting upward march through all sorts of markets over 100 years.  Or you can look at the data that shows that historically consistently investing in stocks has never lost money over a 20-year horizon.

S&P 500 since 1950

That brings us full circle.  We’ve been bashed in the face the past 6 trading days.  Stuff like this happens.  I have total faith in capitalism which means I have total faith that things will recover.

When people have asked me what I think will happen/what I think they should do, I tell them to keep on keeping on.  Keep investing in your 401k, keep putting away money in the 529 and your IRA.  It’s probably a lousy time to withdraw a ton of money for a beach house or some other massive expenditure, but beyond that, what’s going on in the stock market really shouldn’t be impacting you at all.

Jan 2018 has been sizzling . . .

. . . and it shows you can’t outsmart the market.

It’s been a mere three weeks into the new year, and stocks are way, way up: US stocks are up over 5%, and international stocks are up nearly 6%.  IN THREE WEEKS!!!  That’s crazy . . . crazy awesome.

As you sit back and count all the money you’re making in the market, let’s put January 2018 into perspective.


How special is this?

5% in a month (and we aren’t done yet) is good, but not too special.  Since the S&P 500 began in 1950, there have been 90 months at least as good as this January has been.  That’s about 11% of the time, so a little more than once per year on average.  So that’s not too special . . .

. . . But this one is coming off the heels of some really strong performance.  In the past, most months at had at least a 5% return were rebounding from the previous month which wasn’t that good.  So for example, in September of 2015 that month had a 6.6% return but the month before the market was down.  Same thing in October 2015, October 2011, December 2010, September 2010, and July 2010 (those are the most recent 6 instances).

It might make sense for a really good month if it was sling-shotting off a really bad month, like those most recent examples.  Yet, that’s definitely not what we’ve seen.

January is actually the 10th month in a row that the S&P 500 has been up.  Since 1950 there have been two other streaks like that, in 1954 and 1958 (both of which were 11-month streaks).  So we’re in one of the longest, sustained market runs of all time, and we just busted out a 5.1% month.  That’s a bit like running a marathon and in the 22nd mile kicking out a 4:00 minute-pace.

No matter how you cut this, the market for the past year has been really special.  We’ll be telling our grandchildren about this.


You can’t outsmart things

The market is a benevolent teacher.  Actually, maybe not benevolent (some of the market’s lessons can be quite harsh), but certainly a teacher.  There’s a valuable lesson here.

Go back in time three weeks ago.  We were all enjoying football games on New Year’s Day, making resolutions we probably won’t keep, and taking stock (pun intended) of how our investments went in 2017 and what we can expect in 2018.

There was every reason to think 2018 might be a bad year for stocks.  Stocks had just been on an incredible run, so it wasn’t unreasonable to predict a bit of a correction.

Of course, there are a million ways you could go, but there are a ton of really reasonable arguments you could make for why the market might not do so well in 2018.  Yet, so far in January it has busted out a huge month, and if you are fully invested you have made a ton of money.

On the other hand, if you tried to outsmart things and time a market decline, you missed out on a really great month, and that has costed you hundreds or thousands or hundreds of thousands of dollars.

The point of all this is, and I certainly eat my own cooking on this, that you can’t predict the market.  You can spend countless hours trying to figure it out, but it’s unfigured-outable.  The best thing you can do it invest your money and keep it in the market until you need it.


That said, I hope you have been fully invested and those numbers on your spreadsheet have been going up and up.


Dear 2017, You were pretty awesome

As the door closes on 2017, let’s take a few minutes to reminisce about what an incredible year 2017 was for investors.  For the Fox family it’s awesomeness was especially welcome given that our careers have shifted quite a bit, moving away from working for the man to working for ourselves (though, one of us happens to be a man).

Let’s look at the numbers, and figure out what it all means.


A tale of the tape

Like most investors, we had a really good 2017.  Here is how our portfolio broke down:

Investment

Portfolio weight

2017 return

US stocks (VTSAX)

52%

19%

International stocks (VTIAX)

37%

24%

Real Estate Investment Trusts (VGSLX)

7%

1%

Commodities (DJP)

2%

1%

Lending Club

2%

2%

TOTAL

100%

19%


Cha-ching

No matter how you look at it, 2017 was a GREAT year for stocks.  The US stock market did really well, growing 19%.  This can become really political really quickly when assigning credit/blame for such things to politicians.  However, I think it’s fair to say the Trump administration has been fairly pro-business.  That, along with the massive tax cut, definitely gave a boost to stocks.

Also, we saw economic growth really pick up while unemployment went to historic lows.  And all that was happening while inflation remained very low (more on this in a second).  If you put all that together, that’s a perfect recipe for awesome stock performances, and that’s exactly what we had.

Not to be outdone, international markets really kicked it into high gear.  Coming into 2017, US stocks had outperformed international stocks (pretty dramatically, actually) for four years in a row, every year since 2012.  That ended this year.  International stocks were up an astounding 24% compared to the paltry 19% that US stocks were able to muster.

I think that’s a good reminder that you can never really outsmart the market.  At the beginning of 2017 there was every reason to believe that US stocks would do better.  There was a ton of momentum in the US coming off of Trump’s election.  Plus, Europe seemed embroiled in political quagmires—Brexit, French elections with extreme candidates polling well, Greece being Greece.  Asia similarly seemed poised for another yawn of a year—Japan remain in a deflationary stagnation, Noth Korea being a total wild card, and it looked like China’s economy would slow down.

Our interpretations were dead wrong and those markets kicked butt, and international markets outpaced the US markets by 5%.  5%!!!  That’s a lot actually.


Inflation remains dormant

While all this was happening, inflation remained remarkably tame.  You know I spend a ton of time and energy talking about inflation because it has such a big impact on the purchasing power of your savings.

Huge returns like we had in 2017 are great, but what’s the point if those gains are all eaten away by higher prices?  The final reading for December will come out in mid-January, but preliminary readings indicate that inflation for the year will come in at about 2.1%.  2.1%!!!  As high as those 20-ish% returns were, that’s how low 2% inflation is.

As an investor, it really doesn’t get much better than that—high returns and low inflation.


Regrets, I’ve had a few

As you know, I always use New Years as a natural time to take stock (no pun intended) of things.  Now is a really good time to look at how we did, thinking about the things we did well with our investments and what we could have done better.

The high points of our investments were the US and International stocks.  We invested in all index mutual funds so we really didn’t do anything here.  Just “set it, and forget it”.  I suppose that speaks to how useless I am as an investor—the best part of our portfolio is the one that I did the least for.

Certainly, we did have some not-so-great investments.  I hate to be picky in a year where our portfolio grew 19%, but 2017 really exposed some stupid decisions that I had made.  Look at our returns, and the two “basic” investments that everyone should have (I even wrote a whole post on this very subject).  Those did the best.

The investments that did the worst were those “other” investments that aren’t one of the three basic ingredients.  I’m stupid, and that stupidity probably cost us $50,000 this year.  Ouch.

I’ve chatted about our commodities investment and our Lending Club investment, both of which have been incredible duds.  Currently, we’re in the process of eliminating those from our portfolio, so hopefully in 2018 we won’t have to deal with that crap.  Of course, because the investing gods like to humble stupid people, I am sure those two will perform spectacularly this year.

As for the REIT, over the longer-term it’s done fairly well (not as good as US stocks but better than International stocks).  This was just a down year, so that happens sometimes.  Still, it begs the question why we got into this instead of just sticking to the three ingredients, and I have some lame excuses, but nothing worth mentioning.  Hmmmm.


So there you have it.  2017 was an incredible year for being an investor.  Despite the couple misses we had, our two biggest investments really did well, so we’re happy.

How about you?  How did your portfolio do in 2017?

RIP Inflation

I’m trying to build my audience, so if you like this post, please share it on social media using the buttons right above.

Inflation is dead!!!  That’s quite a proclamation.  Is the stress of the holidays getting to me, making my mind soft?  Or is there something really to it?

If you are a regular reader of this column, you know that inflation can have an enormous impact on your financial plan.  You also know that I think that the government’s official measure of inflation (CPI) is way overstated.  No matter what you think, it’s undeniable that inflation is important and generally the lower the better.

If you don’t want to read the whole column, I’ll give you the answer: robots and engineering.  If you’re interested in my reasoning, read on.

Quick Crash Course

Inflation basically comes from one of two places:

  1. The government going insane and turning the presses on to print more money. This is hyperinflation and Zimbabwe and Venezuela lately and the Weimar Republic in the 1920s are good examples of this.
  2. The general rise in prices as people demand more for their labor and raw materials get more scarce, leading to increased prices.

Say what you will about the insanity of Washington, but #1 really isn’t a concern.  So inflation for the rich countries of the world really comes from #2.

Oil

The latest bout of really bad inflation in the US was in the 1970s and carried over to the early 1980s until Ronald Reagan and Paul Volker punched inflation in the face.  That was started by the oil shocks that OPEC imposed on the world.

Oil production was curtailed which drove prices higher.  Oil is a bit of a unique commodity in that we used it (and continue to do so although to a lesser degree) in nearly every aspect of life.  More on that in a minute.  Our world was based on oil so we really couldn’t do with less, so we had to pay more.  We really didn’t have a choice.  Prices rose (inflation).

Thirty years later in the mid-2000s oil prices dramatically rose again to $150 per barrel as demand from India and China shook the markets.  Again we had to use oil so we paid the higher prices, but then that story ended differently.  Technology had advanced so we could use less oil—natural gas powerplants, hybrid cars, solar panels, etc.—which took a bite out of the 2007 oil shock.

Also, and more importantly, technology also allowed fracking and oil sands to produce amazing amounts of oil in the US and Canada.  All the teeth were taken out of the OPEC threat.  Prices cratered over the next few years and have remained at very low levels.  If oil ever goes up again, more fracking and shale sands will be mined to bring prices back down.  We’re probably set with oil prices being moderately controlled for the next 100 years.

BOLD PREDICTION—Oil prices will never rise faster than 2% for the rest of my lifetime.

Other raw materials

Oil is a very unique raw material in that it is used everywhere.  Others aren’t nearly so ubiquitous.  That said, raw materials can increase in price.  However, when that happens our dynamic economy has shown an amazing ability to engineer products to substitute the more expensive raw materials for cheaper ones.

The price of copper has doubled over the last 30 years (from about $1.50 per pound to $3.00 per pound).  That should cause inflation yet think about engineering.  Thirty years ago how much copper was used in telephone line—a ton (literally)?  Now that’s all fiber-optic cable (mostly plastic—which is cheap) that carries a 1000x information at marginally higher prices.  Copper pipes used to be used exclusively in homes.  Now it’s PVC which is cheaper and more durable.  You get my point.

You can also have commodities like foodstuffs (cows and bushels of corn).  In the past those have increased in price significantly.  However, as an economist would predict, as the price goes up farmers plant more corn and ranchers husband more cattle.  That keeps everything at relatively steady prices.

When ever anything gets more expensive, businesses, with their profit motive, will find alternatives to do the job better at a lower price.  That is going to keep a major cap on inflation.

BOLD PREDICTION—There won’t be raw material whose price goes up significantly while also whose use increases significantly.

Robots

The largest component of inflation is human labor.  In the past, there has always been a general pull towards higher wages.  When the economy is weak (unemployment is high) that tends to slow or even stop.  When the economy is strong (unemployment is low) companies have to compete for workers and they do so by raising wages.  That leads to higher prices.

Of course, higher prices don’t always translate to inflation.  If a person is paid more but is much more productive (thanks to computers or other tools) that doesn’t lead to inflation, and if the productivity improvements are large enough will often lead to deflation.

However, and here’s the political hot potato, those productivity advances tend to be focused on the highest-skill workers.  Engineers now have computers to make them more productive; airline pilots have more advanced aircraft; construction workers have better tractors.  When most of those people got pay increases it was because they were more productive, no their impact on inflation was minimal.

The low-skill workers really haven’t gotten productivity enhancements, so any pay increases they got typically led to inflation.  But look at what has happened to all those low-skill jobs.  They have disappeared or are disappearing.  You don’t have gas-station attendants and grocery-store baggers anymore.  Cashiers are quickly disappearing.  Soon waitresses are going to disappear.

Most of the time the extinction of these jobs is because technology (robots) can replace them at a fraction of the cost.  Politically and socially this is deep water and we could debate this for hours whether this is good or bad.  But from an inflation perspective this is definitely keeping a cap on inflation.  If the wage for a low-skill job rises to fast, a robot or computer replaces it at a cost of pennies on the dollar.

Go to your grocery store and see all the self-checkout lines.  Each of those used to be manned by a low-skill worker.  Now one worker is overseeing 8 lines.  Many restaurants have self-order tablets which eliminate the need for waitresses (now you only need servers).  Of course countless low-skill factory jobs have been eliminated by robots.  You could go on and on.

This puts a huge cap on inflation, leading to much of what we see:

  1. Stagnant wages for low-skill workers
  2. Exponential growth of people-replacing machines
  3. Persistently low inflation.

BOLD PREDICTION—Wages for skilled workers will continue to increase while unskilled workers will decrease. Only a minimum wage will keep wages at the low end up, but that will lead to fewer low-skill jobs available.

The Federal Reserve has said it is baffled by the persistent low inflation in the face of fast economic growth, historically low interest rates, a low unemployment.  In the past those three ingredients always led to inflation, something that the Fed is chartered to control.  To me it seems like an easy situation to figure out, but I am smarter than a Nobel Prize winner ?.

It’s pretty simple—we aren’t going to have inflation because there are so many amazingly smart (and very well paid) engineers that can find any product (including people) whose prices are rising and replace them with cheaper substitutes.

Like I said before, there are social implications for this which make these issues very gray.  However, keeping to the black and white areas, I believe this means inflation will probably remain low for years to come.  As an investor that’s GREAT NEWS.

My, oh my, how money has changed

We just got back from a trip to Disney with Lil’ Fox and Mini Fox.  As an aside, Disney World is a pretty amazing place and I highly recommend it to anyone.

While we were on the trip, I was thinking about similar trips my dad took with me and trips his parents took with him.  Because I always think about finance and money, it got me thinking how people paid for those trips—not necessarily how they saved for the trips (which is, of course, an important thing), but how they actually paid money at the point of sale.

Money seems like a real constant in our lives for decades and centuries and millennia.  However, it’s hard to think of something so central to our lives that has changed so drastically over such a short period of time.  In the past 100 years it has changed more than food or clothes or shelter.


Things used to be really risky and inconvenient

Back in the day, let’s say when my dad was a cub in the 1950s, everything was paid in for in cash.  There were innovations like Traveler’s Checks that substituted for cash, and I imagine many people thought of those the way today many people think of Bitcoin—kind of confusing and you aren’t really sure you “get it”.  It was just easier to use cash, something they understood and were used to.

Pretty much all of life revolved around having a ton of cash on hand to conduct your life- -groceries, gas, vacations, washing machines, everything.  That was hugely inconvenient and also incredibly risky.  I remember my grandfather taking about his money belt and false wallet, both tools meant to counteract enterprising pickpockets.

A couple decades later, let’s say the 1970s, charge cards hit the scene, first for department stores and gas stations.  Those could only be used at a specific store (your Sears card could only be used at Sears), so that wasn’t super convenient, but it was a major improvement.

In the 1980s, credit cards as we know them today became widespread.  Credit cards cousin, debit cards, which act in pretty much the same way but deduct straight from your checking account, were being used broadly by the 1990s.  Even though that’s where we are today, even credit cards have evolved in a major way.


The modern art of buying

Today the vast majority of retail transactions are done with credit cards, but the credit card you’re using is very different from the one my dad used in 1983.  Probably the biggest difference is that nearly every credit card offers a pretty substantial bonus of some sort.  It can be airline miles or hotel points or cash.  This can be a pretty big deal.

The Fox family plays credit card roulette (we get a new credit card every few months to take advantage of their initial purchase bonuses) and that nets us about $2,500 each year.  That just paid for our vacation.

All that said, we are very far from the cutting edge when it comes to this stuff.  In the mid-2000s this crazy thing called “Paypal” hit the scene.  When I was in grad school the cooler kids were using Paypal and paying each other for stuff.  I didn’t fully get it, and I admit that I don’t use it today.  Nonetheless peer-to-peer pay networks were here.

Fast-forward a few years and you got digital currencies like Bitcoin.  As much as I don’t fully understand Paypal, I understand Bitcoin even less.  What I do know is that Paypal was based on US dollars but offered a different and more convenient way to pay.  Now it seems Bitcoin is based on its own currency and then also offers a different and more convenient way to pay.

Add on to that, if you like a bit more risk in your investing portfolio, Bitcoins themselves, beyond just the ability to pay for stuff, can go up or down in value so it that way it looks like an investment (or gamble).  One Bitcoin was worth $1000 at the start of the year and now is worth about $7000.  Crazy.


What it all means?

For finance and history nerds like me, I think this is a really fascinating study.  I have always said that inflation is way overstated and I think we can find one of the reasons here.  Think about how much easier and faster things are for businesses now with credit cards and other electronic financing compared to the cash economy of my grandfather’s time.  That impacts nearly everything so the stakes are high.  That savings gets passed on to the consumer, and we get lower inflation.  Score.

Second, today, there’s a huge upside to using money innovations like credit card rewards.  It can pay for our Disney vacation every real.  That just became real.

If credit card rewards can do that for me today, and I admit I’m a late adopter when it comes to this stuff, what is the upside still out there.  Are there similar dollars provided by the Paypals and Bitcoins of the world that I just don’t understand enough yet to pick up off the ground?  Probably.

Are there going to be further money innovations in the future that will provide even more dollars?  Certainly.  I don’t know what they are in a similar way my dad in 1983 could never have imagined Paypal or Bitcoin, but they’ll certainly be there.  If today I’m basically getting a vacation for free, who knows what money innovations will bring me over the next few years.

Maybe that should motivate me to figure out this crazy, newfangled Paypal and Bitcoin things.


You missed the boat

We all know that stocks have been on an absolute tear lately (that’s the reason I’m smarter than a Nobel Prize winner).  In fact, if you look at 11 months since Donald Trump was elected, stocks are up about 20%.

On election night the S&P 500 was at 2140 and now it’s at 2550.  It’s blown through major milestones like 2200, 2300, 2400, and a few weeks ago 2500; all in fairly short order.  If you are fully invested you’re loving it and obsessively looking at your spreadsheet to see how your net worth is climbing (okay, maybe that’s just me).

If you aren’t invested, this is a definite missed opportunity.  There are a couple ways you can go with that:

  1. Just don’t invest because you feel you missed the boat already.
  2. Go all in now to not miss any more.
  3. Hold off to wait for the market to fall again, and then invest on the dip.

As you can probably guess, I think #1 is a bad idea and I would recommend #2.  However, what about #3?


Waiting for the downturn

We all know that stocks have been on an unrelenting upward path.  The S&P 500 started at 17 in 1950.  Today it is over 2500.  Of course, it’s never a smooth path.  You’ve had bumper years like this one, really since 2008, all of the 1980s and 1990s, etc.

You’ve also had your downturns.  Some have been long grinds like the 1970s while others have been sharp like the Great Recession.  However, even with those, we’ve definitely done well.  That said, if you missed out on a good run, should you just wait for the next downturn to get back in?

First, I believe that it’s impossible to time that well.  But let’s say your crystal ball is working really well. How often will stocks fall back so you can get back in at the lower levels you missed before?

I looked back at the S&P 500 since it started in 1950, and I looked at all the major milestones for the index.  On January 1, 1950 it started at 16.66, so the first major milestone was 20.  It passed that level in Oct 1950 and it never looked back.  Never again did you as an investor have a chance to get in at 20*.

Same story for milestones 30, 40, and 50.  In the 1950s the stock market did its relentless march, and every time it passed those levels they were never seen again.

It was a different story in the late 1960s and early 1970s.  A MAJOR milestone was hit in June 1968—100 on the S&P 500.  You could imagine this was accompanied by the usual fanfare of surpassing such a level.  The 1970s proved a lousy time for stocks, and the S&P 500 had major moves above and below 100 eleven times.  That’s a lot.  It wasn’t until the Reagan bull market of the 1980s that the stock market broke the trend.

For milestones 150, 200, 400, and 500 there were no pull backs (300 had a pullback thanks to the crazy one-day plunge in 1987).  So again, just like the 1950s, the 1980s and 1990s had a stock market that just blazed through, and if you missed it you missed the boat.  Never again would those levels be seen again.

Milestone First time Revisited
20 Oct-50 0
30 Jul-54 0
40 Jun-55 0
50 Sep-58 0
75 Dec-63 2
100 Jun-68 11
150 Mar-83 0
200 Nov-85 0
300 Mar-87 2
400 Dec-91 0
500 Mar-95 0
750 Nov-96 0
1000 Feb-98 3
1500 Mar-00 6
2000 Aug-14 3
2500 Sep-17 0

Since the 2000s we’ve crossed four major milestones—1000, 1500, 2000, and most recently 2500.  All of those were revisited, mostly due to the Great Recession where the S&P fell from about 1565 all the way down to 670.

Since the Great Recession, the market has been blazing, but it’s been crazy in the process.  The market cleared 2000 in August 2014, but has gone through some brief downturns with fast recoveries like January 2016.  I think more recently we’ve experienced greater volatility in the market, so revisiting might be more common.


Bottom line

That was a gripping history lesson, but what does that mean we should be doing now?  Overall, I think the data shows that stocks always go up.  Sure there will be bumps, but if you invest now, the data shows that, at least based on history, you’ll make money.

On the other hand, despite this crazy good bear market recent years, there have been revisits of these levels.  Are we going to see the S&P 500 at 2000 again?  Maybe.  Based on recent history, I wouldn’t be surprised.  However, I certainly wouldn’t bet on it.  I mean that in the literal sense—I wouldn’t wait to invest my money until I saw a market downturn.  I think it more likely things will keep cranking along and 10 years from now we’ll remember the good ole days when the S&P was at 2500 the same way we think about $0.10 hamburgers from McDonald’s.

You might have missed this boat, but you don’t want to be on the sidelines when the next boat (S&P 500 at 3000) comes around and miss that one too.


* I defined “revisited” is going under the milestone at least 100 days after it passed it.  This is to keep from counting times when it gyrates above and below the milestone over the short term.  For this we wanted to look at times where the market was comfortably above the milestone and then at a later time period fell below it.

Invest in 401k before you payoff student debt

“The longest journey begins with a single step” –Laozi (580 BCE)

Investing is a long-term game.  As that really smart Chinese philosopher said, that long-term game needs to start with your first move.  For most people, investing will start when they get their first “adult” job after college (you already know how I feel about college).

Some people start with a clean financial slate when they leave college, but many have student debt from all the loans they took for that degree.  That sets up an interesting question as they get their first paychecks: what to do with the money?  You can even make the question more precise and ask: should I use my savings to payoff my student loans or start investing?  Let’s dive right in

My niece Starty Fox just graduated with her engineering degree from State U.  She has $20,000 in student loans that has an interest rate of 4.45% (I think that’s the current rate for government backed student loans).  Because she listened to her wise uncle, she got an engineering degree which presents many job opportunities.  She took a good job paying $54,000 per year (luckily her salary is divisible by 12 so this post is a little easier to write).  Plus, they offer a 401k which matches her contributions up to 6% of her salary.

After she accounts for rent (her parents made it clear she could visit, but not live with them), her car payment, food, and other living expenses  she is able to save 10% of her income each month.  She makes $4,500 per month and has $450 left over at the end of each month (let’s ignore taxes for a second, but just a second).

So what should she do, payoff that nagging student debt as fast as she can or start investing in her company’s 401k?


A match lights the world on fire

Let’s say Starty has a neurosis about her debt.  She was raised never to have any debt (although maybe that’s not always the best idea—here and here), so she wants to pay it off as quickly as she can.

If she applied all $450 each month to her student loans, she would pay off that whole $20,000 in a little over 5 years.  There would be a couple things she wouldn’t like.  First, that $450 would be taxed (just like the rest of her income).  Let’s say her marginal tax rate is 20%, so that means the $450 she has set aside is really only $360 after she pays Uncle Sam.  Taxes are unavoidable, so while that’s a bummer for Starty, she accepts it as a fact of life (although maybe she shouldn’t—more on that in a second).

When it is all said and done, she will have paid everything off by the time she turns 27, which isn’t bad.  Through it all she would have paid about $2,300 in interest.  That interest is tax deductible, so it would only feel like about $1,840.  After everything is paid off, she can start investing in her 401k with a clear conscious.

Let’s take the other extreme, and assume that Starty watched Wall Street a lot with her adoring uncle when she was little.  She’s not too concerned about debt, especially when there are other good investment opportunities out there.  She pays her minimum payment on her loan ($150 per month before taxes, $120 after taxes) and then invests the rest in her 401k.

Obviously, the downside of this is it takes her a lot longer to pay off her loan; instead of being done by age 27, she’ll have the debt until she’s 40.  That sucks.  But she more than makes up for that with her 401k.  Every year she contributes $3,600 to her 401k.  When she does this she has three really big spoonfuls of awesomeness working for her:

  1. Tax free—her 401k contributions are pre-tax so just off the top she is saving $30 per month that would go to taxes if she used that money to pay off her loan. That’s enough to buy a new Lululemon outfit and splurge on extra spin classes each year (Foxy Lady just took over my computer for a second).  Sure, eventually she’ll have to pay that in taxes, but there are a lot of things she can do to minimize that when the time comes.
  2. Match—the big one is that Starty gets to take advantage of her company’s match. They match dollar-for-dollar up to 6% of her salary.  Since she’s contributing more than that, she takes complete advantage of the match, and that comes to $270 each month.
  3. Investment returns—obviously this is why we do invest money. On average Starty is going to earn a 6-8% return on her 401k.

If you put that all into the pot and mix it, you’d have a 27-year-old Starty who is debt-free but with nothing in her 401k, or you could have a 27-year-old with $41,000 in her 401k and still with $16,000 in student loans.  Obviously, the 401k option is much better. She has a net worth of $25,000 on her 27th birthday (versus $0 if she paid off her student loans first).


The cause of it all

Those numbers tell a pretty powerful story that from a mathematical point of view, paying off your student loan at the lowest level is best so long as you put that money into your 401k (and not spend it on stupid crap).  However, there are some fairly big assumptions there.

Match—obviously the match is a big part of it all.  Without the match the numbers don’t look nearly as good, but the 401k option still comes out ahead.  On her 27th birthday, she would have a net worth of $5,500, without the match.  Many people may complain that this example isn’t realistic because Starty’s 401k match is so generous, but without the match she still comes out to the good.  And we know a 401k without a match is basically like a traditional IRA which is available to everyone.

Liquidity—when Starty chooses to go all in on her 401k she’s losing a lot of financial flexibility.  At 27 she’ll still have $15,000 of debt that she’ll have to pay off plus she’ll have a lot of her money tied up in her 401k which is very hard to access.  If something happened at ages 22-27 she’d be in pretty much the same boat either way, but after age 27 she’d have a little more flexibility if she had killed the college debt.  This becomes a question very similar to the one we raised with the post on the emergency fund.  Personally, I would be willing to roll the dice for that extra $5-25k over five years, but risk aversion is different for all of us.

That’s all good, but fundamentally this boils down to Starty being able to borrow money at 4.45% (3.6% after taxes) and being able to invest it at a higher rate, 7% for argument’s sake.  Over a 20 year time horizon (about how long it takes her to pay off her student loan), stocks have historically done much better than that 4% hurdle.  For all these reasons, it does make a lot of sense—in Starty’s case thousands of dollars each year—to slowly pay off her college debt and put that money into her 401k.