Are you gambling or investing?

dice-scene-1-1


I’ve done a ton of posts on how over time stocks are a great investment, and I absolutely believe that.  However, like with all things, if you look at the extremes you start to see funny results.  Particularly, over the very short term, stocks aren’t really good investments at all.  In fact, if you “invest” in stocks and have a really short time horizon, you aren’t investing at all but rather you are gambling.  So investing or gambling, what’s the difference?  And when does stock ownership switch from gambling to investing?

As always, this is when I nerd out and get my handy dandy computer and free data from the internet and see what the numbers say.  Hopefully it’s not surprising that the longer you hold on to an investment, the lower the probability that you lose money.  But it is interesting how the numbers work out.

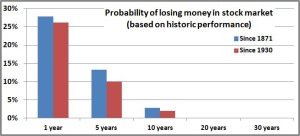
On any given day, there is a 46% chance that stocks will go down.  That’s not quite a flip of the coin (since stocks go up over the long run, you’d expect them to have more good days than bad), but that’s pretty darn close.  So let’s agree that if you’re investing for only a day, then you’re gambling.

Graph

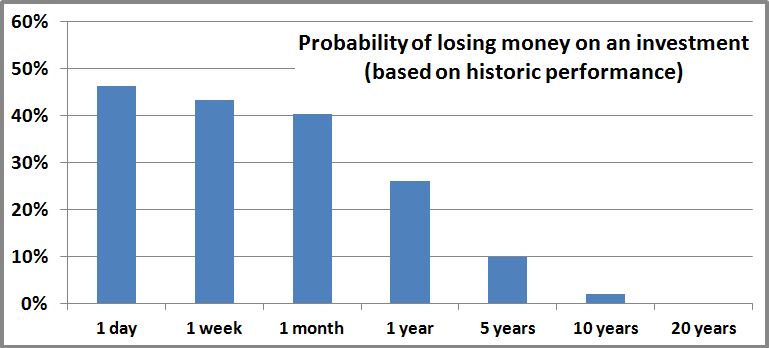
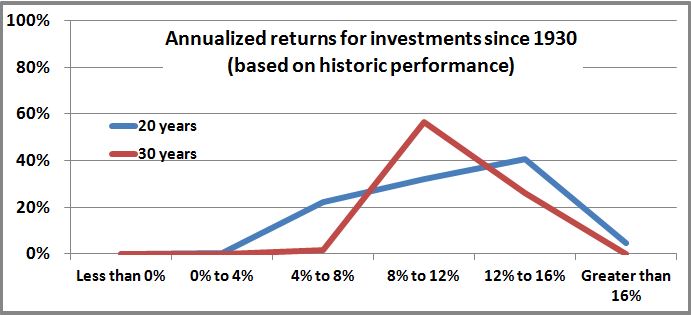
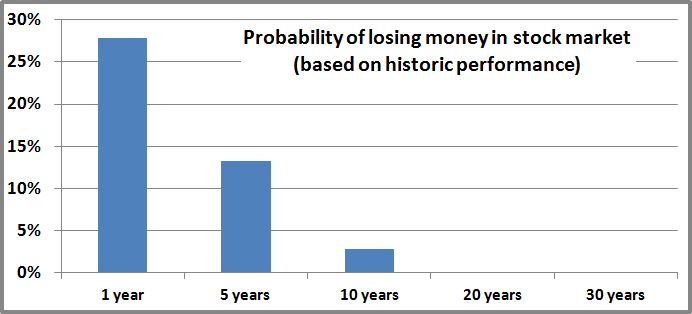
Obviously, you can contrast that with the other end of the spectrum where historically there hasn’t been a 20 year period where you would have lost money.  0% chance of losing is not gambling, that’s clearly investing.

So where do you draw the line?  If you move from a day to a week, the chances of you losing money drop from 46% to 43%.  That’s a little better, but that still feels like a flip of the coin to me.  Go from a week to a month, and the chances of you losing money drop a little bit more, down to 40%.  It’s going in the direction that you would expect—probability of losing money drops the longer you hold on to the investment—but we’re still squarely in gambling territory.  If you do something and there’s a 40% chance of it coming out bad, I definitely don’t like those odds.

You can follow the table and see that at 5 years, the chances of you losing money on stocks is about 10% and at 10 years it’s at about 2%.  Clearly there is no right answer, and this is an opinion question so everyone is different, but I figure that somewhere between 5 and 10 years is when purchasing stocks ceases to be a gamble and starts being an investment.


Recreational investing

One of the things I try to do with this blog is help people better understand the stock market and how it behaves by looking at historic data.  I think this is a good example.

As I said at the start, the stock market is a great place to build wealth but you have to be smart about it and you have to have your eyes wide open.  If you’re investing just for a month or a week or a day, just understand that what you’re doing looks a lot less like investing and a lot more like gambling.  If that’s what you want to do that’s great.  Just be honest with yourself.

This brings me to an interesting topic which is “recreational investing”.  A lot of people come up to me and say they understand that slow and steady, and index mutual funds, and a long-term view are probably the best way to build wealth.  But it’s boring (a sentiment I totally agree with), and they want to keep a small portion of their money so they can “play,” investing in particular stocks they like, similar to the way someone would pick a horse at the track or play the table games in Vegas.  To this I say: “go for it”.

Life is too short, and that stuff can be really fun.  If it’s fun for you to “play the market” and gamble on some stocks, rock on.  Just know that you’re gambling and not investing.  But I’ll tell you, if you have a gambling bug, I’d much rather do it with stocks than blackjack or the ponies.  With stocks, as we saw above, even over a short time frame, you have the “house advantage”.  With other types of gambling, the house has the edge.  So I totally support recreational investing if that’s what you’re in to.


What do you think?  At what point does buying stocks change from gambling to investing?  I’d love to hear.

What a crazy week on Wall Street

“The more things change, the more they stay the same”  –Jean-Baptiste Alphonse Karr

Stocks have taken a really wild ride lately.  Starting last Thursday, they had a free fall down 10%, then they recovered about 6% of that.  Things finally settled down on Friday when the market finished virtually unchanged.

SP500 graph

There was actually a streak of 6 days where stocks moved at least 1%.  Generally speaking a 1% move is pretty big (in this market it’s about 170 points on the Dow).  To have that happen 6 days in a row seemed pretty extraordinary.  More than the steep drops, I think it was the relentless “huge” moves everyday that particularly put my nerves on edge.  I think I can better handle just a crazy day and then accept that it’s over.  Kind of like an earthquake in Southern California; it’s violent and scary, but it just lasts a couple seconds, then it’s over and you know you need to start getting on the business of recovery.

So I wanted to ask two questions:


How often does the market move 1% for so many days in a row?

Before this streak of 6 days in a row, the next longest streak in 2015 was for 3 days.  The longest streak in 2014 was 5 days, the longest streak in 2013 was only 3 days, and the longest streak in 2012 was 2 days.  So that starts to tell me that a 6 day streak is not all that common.

In fact, you have to go back to 2009 and the aftermath of the Great Recession to have a streak of 6 days.  However, that was the tip of the iceberg.  During that time there was also a streak of 8 days, another of 7 days, and two separate streaks of 10 days in a row where the market moved at least 1%.

I think that puts what we just went through in perspective, both for the good and the bad.  First, what we went through was a pretty big deal. Crazy weeks like that don’t really happen all that often, and you survived it so congratulate yourself.

That said, compared to the Great Recession, this was just a small blip.  And that feels right.  During the depths of the Great Recession, people were actively questioning the viability of capitalism and the stock market, and there was a real sense of capitulation.  Those days have left deep scars for many, a lot of whom have sworn off stocks just because that was such a tough time for investors.

I never felt anything close to that during this roller coaster.  When things were falling, sure it sucked, but I sensed that most people were looking at it as a blip that would prove a good buying opportunity (as turned out to be the case).  Sure, it was frustrating when we finished one bad day and then follow that up with another bad day, but again it never seemed people were losing faith.

Put all that together, and I’ll call this a class 2 hurricane.  It caused damage and but no lives were lost.  We’ll forget this in a few months.  That’s very different from a class 4 hurricane (Great Recession) or class 5 (Great Depression).


Has the market gotten more volatile in recent years?

The other thing that occurred to me was is all this market volatility increasing.  You hear people talking all the time about how the market is changing, typically for the worse.  I don’t buy a lot of those arguments, but I do believe that the market is changing in undeniable ways—computers are driving more trades, investing is becoming an international game, investors are getting savvier, information travels much more quickly, and you could go on and on.

I pulled data on the S&P 500 going back to 1950 when the index began.  I counted the number of days where the market moved at least 1%, and I was fairly surprised by the results:

Up 1%

Down 1%

2010s*

12%

11%

2000s

16%

17%

1990s

11%

9%

1980s

13%

11%

1970s

10%

10%

1960s

4%

5%

1950s

7%

6%


Looking at the data a few things stand out.  First, there seemed to be a big change around 1970.  Before that about 10-13% of the trading days had big moves.  But since the 1970s, those days jumped up drastically to at least 20%.  I tried to think what would have caused this stark change and I couldn’t come up with anything.  Sure, the world has changed drastically since the 1950s, but was the change from the 1960s to the 1970s any greater than, let’s say, the 1990s to the 2000s?  I don’t think so, but something happened.  The data’s definitely there.

Second, the 2000s were the most volatile decade in this data set.  If you look back then, that makes sense.  The decade was bookended by two disastrous periods for investors—the tech bubble popping in 2000 and the Great Recession in 2008.  Both periods put stocks in an absolute frenzy, diving one day then freighting a recovery the next.  I’m not old enough to have lived through the Great Depression or the lost decade of the 1970s, but I did feel I cut my teeth in the 2000s.  I suppose in a perverse way, it’s comforting to know how crazy of a time that decade proved to be.

Finally, and most topical, is that the 2010s, so far are a pretty average decade as far as volatility goes.  Sure you had the past week and a half which was a whirlwind, but as we saw at the top of this post, the previous years were pretty calm.  This decade compares pretty favorably to the 1990s, 1980s, and 1970s.

I think it’s important to put this in perspective and somewhat debunk all the doomsdayers who tell us that things are so different.  The opening quote, “the more things change, the more they stay the same,” which to further prove it’s point was first coined in the early 1800s, seems to prove its wisdom.  Sure we can get caught up in all the craziness of the past few days, and that’s okay.  But let’s not lose sight of the fact that this is just the way the stock market is and has been for a very long time.


* 2010s are through 28-Aug-2015.

Commodities—Stocky’s worst investment of all time

I know you look up to me and imagine that all my investments are good ones.  Oh, if only that were true.  I have had my share of lousy investments, but far-and-away the worst is my investment in a commodities ETF (ticker symbol DJP).

My general philosophy with investing is pick a broad index mutual fund.  Over half of the Fox portfolio is in a US stock index mutual fund (VTSAX) and an international stock index mutual fund (VTIAX).  Yet, back in 2010 Foxy Lady and I made the decision that we should also dabble commodities.  Over the past five years, that investment has lost about $40,000.  Here is our sad tale.

basket_1870914b


What we did?

In 2010 Foxy Lady and Stocky Fox engaged in a nuptial extravaganza that Chicagoans still talk about (not really).  Now as a married couple, we decided that investing in commodities (after we maxed out our 401k’s, of course) might be a good idea.  The financial world was still licking its wounds from the 2008 financial crises so there was still an underlying discomfort with stocks.  Plus, the world’s central banks were doing a lot of crazy shenanigans like Quantitative Easing and other things that might lead to major inflation if not handled just right.  Finally, commodities had an amazing run up in the previous few year, but then got hammered during the 2008 recession, so they were well off their highs; they seemed like a bargain at the time.

Dang!!!  Do you see two or three basic invest rules that we broke there?

I started doing research on what type of investment would suit our needs.  There were some mutual funds out there, but they invested in companies that were related to commodities.  Vanguard’s Precious Metals and Mining Fund (VGPMX) was composed of stocks whose companies owned mines and things like that.  That didn’t make sense because we already had broad stock mutual funds that probably already invested in those companies.  We wanted to own the actual commodity, the actual gold so to speak.

There were a lot of ETFs that tracked a specific commodity like oil (ticker symbol, surprisingly, is OIL), natural gas (GAZ), livestock (COW), grains (JJG), and on and on.  I liked the sound of that, but I wanted to be really diversified with commodities, so I didn’t want to have to buy 10 or 20 different ones.  I kept searching and I found DJP—it seemed like everything I wanted.  In a single investment we got a mix of energy, precious metals, industrial metals, livestock, and foodstuffs.

We found our winner.  It took a day or two to set up our brokerage account with Vanguard, and then we started making monthly investments into DJP.


What happened?

Things started off well.  After a year, commodities prices had gone up about 20% or so, and we had made a few thousand dollars on this investment.  I was congratulating myself for being a financial genius, and all seemed right in the world.

And then the wheels came off.  DJP peaked in April 2011 at around $50 and then it began its unrelenting, free fall down to about $30 where it sits today.  From a fundamental perspective, it’s easy to see what happened.  The economy started to slow which curbed the demand for commodities, putting major downward pressure on their prices.  At the same time, the fracking revolution happened in the US, unlocking tremendous amounts of oil and natural gas.  Those are the two largest components of DJP, and when all that new supply came on line, it just hammered our investment.

Keeping faith in “dollar cost averaging” we continued to make our monthly investment all the way through November of 2014.  At that point, for tax reasons that aren’t worth getting in to, we stopped continuing to invest, but we still currently hold a pretty decent chunk of DJP.  In March 2015 it hit bottom at about $28 and has since rallied to about $30.  Small victories, right?  That said, we still have a loss on this investment of about $40,000.


Why were we so stupid?

You heard our tale of woe.  So why was Stocky so stupid?  Why does he continue to hold this investment when it’s been so bad?

First, let’s understand the whole reason to invest in commodities.  Unlike stocks, commodities don’t produce anything of value.  When you invest in them, you’re just betting that their price goes up.  Over the long-term commodities have been a horrible investment compared to stocks (which are companies that actually create something of value).

So with all that, why invest in commodities at all?  They are really a hedge or “insurance policy” against the double nightmare of inflation and stagnant economic growth—stagflation.  If central banks started printing money, inflation would rear its ugly head and the pieces of paper we call dollars and euros and yuans would not be worth as much.  However, things like gold or corn or oil or cows would maintain their intrinsic value.

But wait a second.  Aren’t stocks a good hedge against inflation?  After all, they are real assets like property, plant, and equipment.  The answer is “yes”.  However, the largest portion of a stock’s value is the expectation of future earnings.  If the world economy really takes a body blow, stocks are going to lose a lot of value.

Look at these two charts—one is for the price of gold and the other is for the price of oil, the two most common investment commodities.  They had two major run-ups nearly at identical times, in the late 70s/early 80s and right around the 2008 financial crisis.  Those were the two most pessimistic times for stock investing in the past 70 years.

gold

oil

In the 1980s the Cold War was at its peak, OPEC was flexing its muscles, the US economy was crap, interest rates were at 20% and inflation was at 13%.  People legitimately thought that capitalism wasn’t going to survive.  The best thing to own was real stuff that people valued in the here and now.  Similar story with the 2008 financial crisis.  The banking system collapsed and it seemed like central banks were just going to wallpaper the world with paper currency.  Similarly people thought capitalism might be dead, and similarly the commodities had a tremendous run.

In both cases, capitalism did survive and did in fact thrive.  Commodities crashed and the world went on.  But all this illustrates that commodities do act as a real hedge against the armageddon scenario.  Diversification is an unambiguously good thing, so that is why the Foxes hold commodities.  Like all insurance, it’s not something you expect to make money on when things are going well, and keep in mind the stock market has done tremendously well since we started investing in commodities in 2010.  Rather, you want insurance to be there when everything goes to hell.


So that’s our story.  As I said, we still hold a small portion of our portfolio in commodities, but it is far and away our worst performing investment.

How about you?  What was your worst investment?

Era after 1930—inflation adjusted

Philippine-stock-market-board

A few weeks back I wrote a post saying that the chances of losing money in the stock market over the long run are really low, at least based on a historical perspective since 1871.  Yesterday I revised the analysis to look at the era since 1930, and I found that stocks performed even better.

However Andrew H, a reader from Chicago, commented that my analysis only scratched the surface.  I just looked at whether an investor made or lost money, not how much they made or lost.  Also, I didn’t take inflation into account (you know my reasons).  They are very valid criticisms, so I am taking up Andrew H’s gauntlet.

As an aside, Andrew H and I went to junior high together.  He was the smartest (or possibly the second smartest while I on the other hand was maybe the 40th smartest) student in our school, and I admit that I always looked up to him.  This one’s for you Andrew H.


Refresher from last time

We’ve already seen that if you look at returns since 1930 (I’ll explain why I’m starting with 1930 instead of 1871 in a second), the chances of you losing money in the stock market after a year is about 26%.  Of course we know time is on your side, so if you look at a five-year period, the chances of you losing money go down to 10%.  At 10 years it’s 2%, and at 20 years and 30 years it’s 0%–there is not a single 20 or 30 year time period since 1930 where dollar cost averaging in the US stock market would have resulted in a loss.  Let that sink in for a second.

Losing money

But Andrew H raised some very valid points, so let’s see what the data says.


Return distribution

Going back to 1930, we already said that you don’t have a single instance where if you invested the same amount of money every month, that you would have lost money over a 20-year time period.  If you assumed that you invested $10 every month, over 20 years your total investment would have been $2400.

Of all the 20-year time periods since 1930 (there are 768 of them if you’re curious), the worst you would have ever done was starting in March 1989 (ending at the depths of the 2008 financial crisis) and you would have ended up with $3388.  So your $2400 investment increased over 40%.  Of course if you annualize it, that is only 3.3% per year.  But that’s still pretty good isn’t it?  The best it ever got was starting in April 1979 (ending as the tech bubble was peaking in 1999) where your $2400 would have become $20,236 (over 18% annualized).

You can do the same thing for the 30-year-time periods (648 of those) and you get similar results.  You would have invested $3600.  Your worst outcome would have been starting in October 1952 (ending as inflation peaked and the US was in the recession of the early 1980s) where you would have ended up with $12,827.  Just like before, that doesn’t really seem all that bad.  Over 30 years your money quadrupled and that was the WORST it ever got (7.5% annualized).  The best was starting in February 1970 (again, ending with the 1999 tech bubble) where $3600 would have become $62,868 (16% annualized).

If you graph out the distributions you get this:

without inflation

For both time horizons, you see that most of your returns are in the 8% to 16% range.  As we just mentioned, you have some down years where the returns get a bit low, but even then they stay well above 0%.


Including inflation:

You can run a similar analysis but include inflation.  Even I would agree that inflation during some of those time periods were substantial (although of course, not as substantial as the CPI would lead you to believe).  The reason I chose to do this analysis starting in 1930 instead of 1871 is because of inflation.  The CPI started 1913.  You can estimate data before that but I really don’t trust that data.  I think inflation is a questionable enough factor as it is, so there you go.  Either way, I don’t think it changes the conclusions we’ll come to.

So when you invested each month $3600 starting in 1952, how much would your $12,827 buy you in 1982.  Remember that the 1970s and early 1980s had tremendous inflation (peaking at well over 10%), so it is going to have a major impact.

As we expected, those distribution curves shifted to the left (the real returns got worse when we accounted for inflation).  Looking at the 20-year time horizon, you had negative real returns* about 5% of the time.  So there you go.  That’s a bit of a bummer but that’s reality.  There were some periods that started in the 1950s and early 1960s (so they ended in the late 1970s and early 1980s) when inflation would have eaten away your returns and taken you into the red.

However, Father Time comes riding in on his white horse and saves the day.  While there were a few negative periods if you just used 20 years, if you push your time horizon up to 30 years there are no negative returns.  In fact, the worst time period was October 1952 (same as when we didn’t include inflation).  Remember that if you didn’t account for inflation your return over those 30 years was 7.5%, but now if you account for inflation it drops to 1.3% per year.  That’s a big drip and it definitely sucks, but remember, that’s the WORST.  As bad as it gets, the stock market has historically delivered a positive return even after you strip out inflation.

With inflation


I want to thank Andrew H for keeping me honest.  This little exercise has just further reinforced my faith that investing over the long term will make you money (ha, you thought I was going to forget—historic performance does not guarantee anything in the future).  No one knows what the future holds, but if history is any guide, putting your money in the stock market over your investing career is a pretty solid move.


*When I say “real returns” that means returns that have been adjusted for inflation.

Era after 1930

Philippine-stock-market-board

A while back I did a post on the likelihood of an investor losing money in the stock market.  Going back to 1871 the data showed pretty conclusively that if you dollar cost average and give yourself enough time, the chances of losing money approach zero.

As a follow up, I did the same analysis but instead of looking all the way back since 1871, I only went back to 1930.  1871 was a long time ago and reasonable people can debate how relevant investing in the stock market back then is to today.  Fair question.  In 1871 trains and horses were the main modes of transportation; cars and airplanes hadn’t even been dreamed up yet.  Oil had been discovered just 12 years before, slavery had been abolished only 8 years before, and there were a total of 37 states in the US.  So I agree it’s probably too different to be comparable.


On to the results

I ran the same analysis, looking at the percentage of time that a person investing equal monthly amounts in the stock market would come out profitable, but this time I started in January 1930.  Despite the different time period, the data looks largely the same.  The data from 1871 showed that looking at a one-year time period, investments were down 28% of the time; looking at the data from 1930 it’s 26%.  In fact the data seems to be in lock-step, and you can see from the graph, that the bars are virtually identical.

Losing money

But there is a curious feature.  In every instance the data from 1930 is better than the data from 1871—the chances of you losing money were reduced in the later time period.  Why is that?  It isn’t inflation: inflation was worse in the earlier period than the later period (plus you know I think inflation data is suspect anyway).  It couldn’t be geopolitical: both periods had world wars, but the earlier period was more peaceful in the US at least than the later period.  Technology made huge strides in both periods: cars, airplanes, oil in the first period; computers, satellites, internet in the second.  But the data sets are big enough that those differences are definitely statistically significant.


Securities reforms in the 1930s

My theory is the difference is caused by investing becoming a much safer place after 1930 than it was before.  After the stock market crash of 1929 which led to the Great Depression, legislatures passed a host of reforms to better regulate the securities industries, including the establishment of the SEC in 1934.  Reasonable people can take jabs at these reforms, especially when felons like Bernie Madoff, Ivan Boseky, and Jeffery Skilling, cheat investors out of millions and billions of dollars.

But difference between the pre-1930 and post-1930 investing environments is night and day.  Nowadays we can be fairly confident that the companies whose stocks we own are real and that their accounting is legitimate.  Certainly the system breaks down, but before all the regulations were passed it was the Wild West.  Stock scams were rampant instead of being the exception, and it seems to me that successful investing had less to do with investing in good companies and more to do with avoiding thieves.  We’re investing in much, much better times.

The other big difference I see is the Federal Reserve.  Although it was originally established in 1913, it was emboldened in the 1930s in response to the Great Depression and started to take the form that exists today.

To put things in perspective, in 1907 there was a financial crisis somewhat similar in severity to the 2008 crisis (from peak to trough, stocks were down about 50% in both the 1907 and 2008 crises).  Both were crazy times that caused people to legitimately worry about the future of the US economic system.  The difference was that in 2008 it was the Federal Reserve and the Treasury Department (led by Ben Bernake and Hank Paulson, respectively) that guided the country through the mess, while in 1907 it was a private citizen name JP Morgan.

JohnPierpontMorgan

Go ahead and let that sink in for a second.  In 1907, during the worst financial crisis in a generation, it was a banker who rallied the troops to ensure that healthy banks didn’t get killed in bank runs, maintained the credit worthiness of the US and New York City, fended off the palpable crisis of confidence, and ultimately pulled the economy through.  That’s amazing that a single man with no government affiliation had such power, but it’s also unsettling.  Morgan didn’t owe the average US citizen anything; he was serving his own interests (although he certainly positioned his actions as patriotic) and the country was fortunate that its interests lined up with his.

The Federal Reserve has a defined mandate to serve the interests of the American people; some may argue how well it does that, but you’re always going to have that.  Also, in the last 100 years, we as a society have become much more knowledgeable and sophisticated about the tools which can be used to guide an economy.  Back in 1907 I don’t think they had a clue what the concept of “Quantitative Easing” was, but in 2008 it saved the economy.  It’s impossible to know, but I personally believe that had the crisis of 2008 happened a century earlier, it would have led to another Great Depression.


Who knows on all this stuff, but you have my theories.  I absolutely believe that as an investor we are better positioned to succeed than ever before, and that is just one of the many reasons why I have a ton of confidence in the stock market.  This is confirmed when I look at the data.

As a follow-up, a reader suggested that I look at the data and take inflation into account.  Although it pains me to give that much credence to inflation, I will take up the challenge.  Stop by tomorrow to see how the data looks when you adjust for inflation.  If that’s not a cliffhanger on par with “Who shot JR?” I don’t know what is.

What are your thoughts?  Did I get it right, or have I been drinking the Fed Kool-aid?

Putting the Great Depression in perspective

Every time the stock market sneezes, hiccups, or God-forbid vomits, all the pundits start comparing this time to the Great Depression.  “Things haven’t been this bad since the Great Depression.”  You start to hear it so much you kind of get a little numb.  So I’m going to see how the worst financial crisis in my lifetime, the financial crisis of 2008 (diminutively dubbed the “Great Recession”) compares to the big boy.


Just a quick history lesson: Great Depression–Like in so many examples before and after, post World War I prosperity and an expanding economy led to increases in the stock market which led to increased stock market speculation in the late 1920s.  Confidence had been shaken in September 1929 by a fraud scandal in England, causing the US market to swing wildly up and down over the next month.  On October 24, 1929, the stock market crashed 11%, setting off a chain of events that led to the Great Depression.

Great Recession–About 80 years later, a similar script was followed.  In August 2007 a French bank began to have liquidity issues.  This began to unravel the intricately connected international banking system.  As liquidity dried up, questionable loans, especially sub-prime mortgages from the red-hot US housing market, began to go belly up.  The dominos began to fall and the entire banking system seized up.  In the infamous words of President George W Bush “this sucker could go down.”

So here you have the gold and silver medal winners in the “Worst Financial Crisis in the US Since 1900” event.  How do they compare?  You know how they say a picture is worth a thousand words?

graph

That kinda puts it in perspective for me.  Both had crazy steep falls, with the Dow Jones Industrial Average losing about 40% in the first two years of the crisis, but that’s where the similarities end.  In the Great Recession things turned around pretty quickly, while in the Great Depression stocks fell another 40%.  At the Great Depression’s nadir stocks were down nearly 90% from when things started.  Imagine that for a minute.  Today the Dow is at about 18,000; imagine if by 2017 it got down to 2000.  I’m not sure we can really comprehend that.

As crazy as the falls were, the divergent stories of the two recoveries seems even wilder.  For the Great Recession, the Dow rebounded almost as quickly as it had fallen.  It took only about two-and-a-half years to recover from its trough to its starting point.  Then it didn’t stop there; as of this writing it was up about 40%.  Think about that for a second.  As bad as the Great Recession was, today we sit as far above where we started we were down at its depths.

But it’s a totally different story with the Great Depression— it was a long, long grind.  After the Dow hit bottom, it pretty much lingered there for about 20 years.  TWENTY YEARS!!!  Twenty years after the Great Depression started, stocks were still down 50% from their highs!!!  I feel I’m using too many exclamation points, but I feel they’re necessary.  Seven years after the Great Recession the Dow was up about 40%.

And I’ve just been looking at this from an investor’s point of view.  The Great Depression had brutal unemployment that maxed out at 25%; to put that in perspective, the Great Recession’s worst unemployment rates were about 8% and everyone was freaking out.  The Great Depression caused immense human suffering all over the world and played a central role in bringing about the greatest tragedy in human history—World War II.  All that stuff makes the Great Recession look like a paper cut.

So I propose a new rule.  From now on, when stocks take a dive, no one should even try to compare the latest financial crisis to the Great Depression.  Just the same way no basketball player should be compared to Michael Jordan, no band to the Beatles, no scientist to Albert Einstein, and no president to Abraham Lincoln.  The Great Depression is in a class by itself, the likes of which I don’t think we’ll ever see again.  I’m glad we got that out of the way.

Balancing risk and reward

“Nothing ventured, nothing gained”—Benjamin Franklin

Ying_yang_sign


That Benjamin Franklin guy was pretty smart.  This is the second time one of his quotes have landed on this blog.  Now that you’ve entered the world of investing, you need to figure out how you balance the two fundamental, opposing forces of investing: risk and reward.  At its simplest, investments compensate investors who take on greater risk with higher returns.

Think of the least risky investment you could make—a savings account.  You could invest your money and know that your investment won’t lose money.  You could take out the money in a week, a month, or a year; and you would get your original money plus a very small amount of interest.  In the US, the risk of you losing money on this investment is 0%.  Unfortunately, because there’s no risk, the “reward”, the interest you make, is extremely low: less than 1% currently.

Let’s take a small step up the risk scale—short term government bonds.  The chances of you losing money investing in a 1-5 year treasury bond (let’s assume you invest in a short-term bond mutual fund like VSGBX), are extremely low, but it isn’t 0%.  There is a chance, albeit small, that changes in the market (interest rates) could decrease the value of your investment.  You’re taking on a little bit of risk (since 1988 there has never been a year where VSGBX has lost money), and to compensate for that risk these investments historically tend to return about 1-2%.  So you’re being paid a larger return than your savings account because you’re taking on more risk.

Take another step up the risk scale and you get to long-term government bonds and corporate debt (using a mutual fund like VBMFX).  These are riskier because there is some chance that you won’t get paid back; this is true for corporate, foreign, or municipal debt.  These are also riskier because like their less-risky cousins, the short-term bonds we just mentioned, long-term bonds can change in value due to changes in things like interest rates.  The difference with long-term bonds is that the effects are magnified; so if interest rates go up, that would cause the value of your short-term bonds to go down a little, but the prices on your long-term bonds would go down much more.  As you would expect, since long-term bonds are a little riskier (since 1988 VBMFX has lost money in 2 years), they tend to return a little more, historically in the 3-5% range.

Now, take a big leap up the risk curve and you get to stocks.  Stocks are extremely volatile, especially over the short-term.  Since 1930, there have been 24 years (about one-third of the time) where US stocks have decreased in value.  It’s definitely a rollercoaster ride.  Yet, by bearing the risk that in any given year your investment might go down in value, sometimes down a lot like in 2008 when stocks went down 37%, you get a significantly higher return.  Since 1930, stocks have returned on average about 8%.

graph

As you can clearly see in the chart, when you invest in assets with higher average returns (like stocks) you have a lot more volatility in those returns from one year to the next.  When you invest in assets with lower average returns (like bonds, especially short terms bonds or even cash), you enjoy much more stability in the value of your investments.


What’s your appetite for risk?

As an investor you need to determine what your appetite for risk is.  How will you balance the yin of high returns with the yang of higher risk?  At the end of the day, you need to have an investing strategy that allows you to sleep at night.  There’s no amount of money that’s worth freaking out every time the market takes a down turn, and it is certain that the market will take down turns.  Sometimes it will be a free fall like in 2008 when stocks cratered 37% or it might be a long-term grind like from 1973 to 1978 where stocks fell 23% over the course of 5 years.

That said, a long time horizon is your best friend when dealing with a volatile stock market.  While any given year might be crazy, over time there tends to be more good years than bad.  Take 2008: in 2008 stocks fell by 37%, and if you needed your money at the end of that year you were hurting.  On the other hand, if you had a longer-term investing horizon and were able to stay in the market, all your money would be made back by 2012.  In fact, while about 33% of the years have been down years for stocks since 1930, over that same period of there was only one decade, the 1930s, when stocks were down.

So how do you invest?  Well, you need to figure out your risk tolerance.  Here’s a good way to do that.  Imagine yourself as an investor at the end of 2008.  You’re in the depths of the financial crisis, stocks are down 37%, and pundits are saying we may be on the brink of financial collapse.  What do you do?

Some people like Warren Buffett and Stocky Fox (for important statements I revert to the third person) looked at that as an opportunity to continue to invest in stocks, just now we were buying them at a substantial discount compared to 2007’s prices.  In the end our faith was rewarded and we made a killing.  However, there were some times when the news just kept getting bad and Pepto-Bismol came in extremely handy.

Others felt burned by the 2008 investing bloodbath and pulled their money out of the stock market to put it in safer investments like bonds or cash.  They did so knowing their actions limited their potential for higher returns, but many were willing to accept that if it meant not having to risk their money continuing to disappear into the black hole of the financial crisis.

There’s no right or wrong answer.  You just need to figure out where you’re comfortable and invest accordingly.  If you’re willing to weather the storms then you should probably invest more in stocks.  If you’re more risk averse, then you should probably invest a larger portion of your portfolio in bonds.

Just remember, there’s no such thing as a free lunch.  With higher returns come higher risk.  If you want safer investments, you have to be willing to give up higher returns.

Will you lose money with stocks?

This is probably the most common question you get from people who are considering starting to invest in stocks.  It’s pretty understandable; you work hard for your money and the idea of it disappearing into the black hole of an unpredictable and often times not-well-understood stock market is pretty hard to stomach.  Add on that scars from the 2008 Great Recession, 2001 Internet Bubble, Black Monday in 1987, Black Tuesday in 1929, and on and on and on.

So, what’s the answer to the question:  Who knows?  The stock market is unpredictable and no one knows what will happen in the future.  That’s not an especially satisfying answer, but it’s the truth.  If I could predict the stock market I would own my own island in the Caribbean next to Johnny Depp’s.

But I can hear you saying, “Come on, you’re Stocky Fox.  You can do better than that.”  You’re right.  I’m taking on the challenge and answering the question: Will you lose money with the stock market?


I won’t try to predict what will happen in the future, but I think you can look to how things have behaved in the past, and get a pretty good perspective.  Of course, there’s no certainty that the future will be like the past, but that’s the best we have to look at.

You can get somewhat decent data on the stock market going all the way back to 1871.  Back then, your great-great-great grandfather was getting The Stocky Fox as a newsletter delivered by the Pony Express.  Going that far back, you can calculate the percentage of the time that you would have lost money investing, historically.

So imagine starting in January 1871 and investing $10 every month in the US stock market.  By January 1872, you would have invested a total of $120 and your stocks would be worth $128; congratulations, you just made a profit.  You can do that for every 12-month period since 1871 (there are about 1700 such periods), and you come out ahead 71% of the time, which seems pretty good.  But the flip side is that you’d have lost money 29% of the time, and at least to me that is too high to be really comfortable.

Chart for losing money

However, remember that when investing stocks, time is on your side.  Do the same exercise but for five years; if you started in January 1871 after 5 years you would have invested a total of $600 which would be worth $679 in January 1876 (yeah, profit again!!!).  Do that for every five-year time period and you end up losing money only 13% of the time.  By adding another four years to your investing time horizon that decreased the chances that you would have lost money by 20%!!! That seems pretty amazing.

You can keep doing that for longer time periods, and as you could guess, the percentage of times you would have lost money keeps going down.  Astoundingly at the 20-year mark, you would have lost money only one time out of the nearly 1500 periods possible (the one month was June 1912 which, you guessed it, was 20 years before the Great Depression bottomed out).  At 30 years, there isn’t a single time period where consistent investing would have lost money!!!  That’s not a misprint.  Read that paragraph again.

There are no guarantees, but if you use history as a guide, it’s pretty much a sure thing that you’ll make money in the stock market.  Certainly it involves a lot of discipline, investing month after month no matter how bad things look (dollar cost averaging).  Also, it doesn’t necessarily mean you always make a lot of money, but the data seem pretty powerful.  Additionally, I didn’t take inflation into account so that would definitely skew the numbers downward (but you know how I feel about the integrity of the data on inflation, so there you go), but the message remains largely unchanged.

I must confess that I was a bit surprised by the data.  Actually, I spent about 30 minutes going through the spreadsheet to see if I made any mistakes; I’m pretty confident the analysis is sound.  As Dr Brown asked Marty in Back to the Future, “Do you know what this means?” (just don’t take what he says after that and apply it to my analysis).  If your time horizon is 20 years or more, at least based on history, there’s virtually no chance that you’ll lose money.  I figured it would be a pretty low chance, but zero chance?  I didn’t see that coming.  Even people who invested for 20 years then pulled out after the Great Recession in 2008 did fairly well (invested $240 which became worth $339).


So there you go.  My answer to the question posed at the top is still: No one knows what the future holds.  But the historic data confirms my personal belief that the stock market is a really great place to invest your money.  I lose no sleep worrying about the Fox family’s investments increasing in value.  I know over the long term they will.

My optimism overfloweth

“The report of my death was an exaggeration.”  –Mark Twain

A couple weeks ago Robert Schiller published an article warning investors that the next couple decades are going to be tough ones for the stock market, and they should prepare themselves accordingly.  I read this and I have to say that I disagreed with him.  Professor Schiller won the Nobel prize in economics last year and is a world renowned professor at Yale; I was one of 100 students to graduate with honors from the University of Chicago’s MBA program in 2006.  It should be pretty obvious which of the two of us is just a little more credible.

The premise of Professor Schiller’s argument is that stocks are at all-time high valuations, and they have to come down.  Intellectually I agree with this, but I think he’s missing the mark in two major ways:

Robert_Shiller_-_World_Economic_Forum_Annual_Meeting_2012_(cropped)
Nobel laureate, Robert Schiller


Predicting major moves in the stock market is really, really hard

As we learned from A Random Walk Down Wall Street (I’m sure you all went out and read it after reading my incredible review, right?), it’s nearly impossible to predict when things will happen with the stock market.  In 2015 Professor Schiller is predicting we’re going to have a major correction/sustained period of flat stock prices.  Sure, he’s probably right that that will happen, but is it going to be in 2015, or in 2020 when stocks are 50% higher than they are today, or in 2030 when they are double what they are today?

I think this is where history is a good guide.  The 1980s were an awesome decade for the stock market* with returns averaging an astounding 14% per year.  As you can imagine, there were a ton of pundits saying the stock market rose too fast, valuations were too high, things just weren’t making sense–you had to get out of the stock market.  What happened?  The 1990s came along and outperformed the 1980; stocks returned 18% per year.  People didn’t realize that the computer revolution of the 80s was leading to the internet revolution of the 90s, and if you missed the 1990s investing boat because the 1980s had been so good, you were hating life.

Even look at the internet boom and the bubble that eventually burst in 2000.  In the 1990s year after year, the stock market was putting up tremendous gains.  I remember in about 1997 or 1998 the chorus of naysayers was deafening; they were predicting that valuations didn’t make sense, a bubble was building, and stocks were going to plummet.  It turned out they were right, but the plummet happened 4-5 years later.  In the meantime, the DJIA went from 6800 in 1997 to a peak of 11,200 in 2000.  Of course, the bubble burst, but the stock market only went down to 7600 (Sep 2002).  Sure the pundits were right .  . . sort of.  The bubble burst, but if you took their advice when they gave it, you would have missed out on a market that rose from 6800 to 7600 with a crazy ride in the middle.

The history of the stock market is littered with these examples; literally everyday you have some market expert saying the end is near, yet the market consistently proves them wrong.  Professor Schiller is much smarter than I am, and there probably will be a time they the stock market crashes or goes sideways for a long time.  But no one knows when that is (and I would think Professor Schiller would agree that he doesn’t know that either), and you might miss out on a great run in the meantime.


Innovation is always happening

Innovation is one of the main drivers of the stock market.  Companies innovate, figuring out new ways to do it better, faster, cheaper.  This leads to higher profits which lead to higher stock prices.  It was the electronics innovations of the 1950s that led to 160% increase in stocks in that decade, computing innovations of the 1980s; and internet innovations of the 1990s.  Sure you have off decades like the 1970s and 2000s, but those happen less often; even then innovation is still happening, but it’s just not translating to stock gains until later.  Is there any reason to believe that in the next 20 years we won’t have unimaginable innovations that will change our lives the way computers and the internet did?  I think those will happen and I think those will drive stocks higher.

google car

Eventually cars will drive themselves.  My neighbor just bought a Tesla and the thing can start itself, open the garage, pull out, and have the car all nice and toasty, so all Mr Grizzly has to do is get in and go.  There is no doubt in my mind that in a few years they’ll be driving themselves.  Can you imagine once that happens?  Auto accidents and drunk drivers will all but be eliminated.  Old people, blind people, pre-16 kids will have incredible mobility.  Traffic jams will fade away.  Commuters will have hundreds of hours of their life back each year.  And all this innovation will make some companies tremendous profits and their stocks will skyrocket.

Every year solar panels become more efficient and less expensive.  Soon they are going to be as common on roofs as DirecTV dishes.  Electricity bills will go down, carbon emissions will drop (also thanks to automated, electric cars from above).  The world will benefit and some companies are going to make a killing.  Amazing medical advances are happening every day; really smart people at Amazon.com are figuring out how drones are going to change the world; light bulbs are going to last 100 times longer and use 100 times less power; new methods are going to find more oil less expensively.

I’m going to be wrong on nearly all the details I listed above, but I truly believe that I am going to be right on the general message that the innovations we have in store for us are going to dazzle our minds.  And they’re going to make tons of money for the companies that do them, and tons of money for the investors who own those stocks.


So I respectfully think Professor Schiller is wrong.  Investing in stocks is a great investment now and will be a great investment for years to come.  In fact, I’m putting my money where my mouth is and have 95% of the Fox’s portfolio in stocks.  I would welcome Professor Schiller to respond—he’s always welcome to write a guest post 🙂 .  Of course if he does, I will become giddy as a school girl and ask that he pose with me for a picture and then autograph it.


*  I’ll be using the Dow Jones Industrial Average in these examples

How to invest a windfall

raining-money

We got this letter from a reader:

Stocky,

Sadly my father passed away, but he had a $200,000 life insurance policy.  My mom spent $60,000 as a down payment on a house and $40,000 for my sister’s medical school.  That leaves $100,000 left; I was thinking about going into business with a couple shady guys to start a liquor store, but my wife talked some sense into me.  So we decided to invest the money in an S&P500 index fund (VFINX). 

My question to you is, should we invest the $100,000 all at once or spread it out in smaller investments over a couple months?

Walter Y from Chicago, IL


I admit I may have made this letter up as a framing device, but Walter’s problem is a pretty common one.  Maybe it’s an insurance payout, a tax refund in April, a bonus check, or a bunch of cash you’ve accumulated in your checking account.  In fact, every July the Fox family faces this exact scenario when I get my bonus check.  Let me tell you my thoughts on the matter (which of course is not an expert opinion, and which looks at historical price movements but makes no prediction on future stock movements).

When I get my bonus, and what I would have suggested to Walter, is to take the big chunk of money and invest it in equal pieces over a couple months.  Vanguard and most places will let you set up an automatic investment, so in the words of Ron Popeil “you can set it and forget it.”  So let’s imagine for Walter he would invest $10,000 per week into his mutual fund for the next 10 weeks.   Why do I do it this way?  Because I’m a spaz.

If I invested all the money at once, I would be totally freaked out that I would buy at the wrong time—either I would buy the day after stocks went up 1% or I would buy the day before stocks dropped 1%.  Using Walter’s scenario of $100,000 to invest, that would mean I could “lose” $1000 by investing at the wrong time.  That would totally tie me up in knots and I would be looking at the stock market trying to find the exact right time to jump in, like a kid on the playground playing jump-rope.  Of course we know from A Random Walk Down Wall Street, that all that stuff is random so there’s no point trying to time it, but I’m not totally rational when dealing with that much money.

For the blog, I did a little analysis and found that 12% of the time stocks* lose at least 1% in a single day; if I bought the day before that happened, I’m out at least $1000.  On the other side, about 13% of the time stocks rise 1% or more in a day; if I bought the day after that I’d similarly be out $1000.

My fragile nerves just can’t take that so I want to “diversify” the timing of my purchases to even out those big ups and big downs.  This is a strategy called “dollar cost averaging”.  So as I said, initially I would have recommended to Walter that he take the cautious path, take his $100,000 and split it into $10,000 chunks, and invest those each week for the next 10 weeks.


windfall analysis 2

But then using the magic of spreadsheets and the internet, I decided to see what the actual data said.  I looked at every week for the market since 1950 and did a comparison of the two scenarios:

  1. Invest your entire chunk of money all at once
  2. Spread your investment evenly over 10 weeks (dollar cost averaging)

Wouldn’t you know that on average it’s better to invest your entire chunk at once?  I’ve been doing it wrong this whole time, so thank you Stocky Fox.  In fact it’s not even close—historically it has been better to do option #1 about 61% of the time.

The thinking is that historically, stocks have always gone up.  Sure there have been some rough patches, some of which can last a really long time, but the general trend is definitely upwards.  So if you wait to invest your money over a longer time period, you’re missing out on some of that upward trend.  I looked at every week since 1950 (if you were curious, there are about 3400 weeks) and on average you gain about 0.7% by going with option #1 instead of option #2.  0.7%!!!  Holy cow.  Remember that post on The power of a single percentage?  We just found a 1% coupon right there.

So Walter, my advice is to pick a day this week and invest it all in one fell swoop.  You might get hit with bad luck, but the odds are better that you’ll get hit with good luck to the tune of about 0.7% (which in your case is about $700).  On the day you do it, don’t even look at the stock market and have several tablets of Alka Seltzer on hand.

*For this analysis I am using the S&P 500 data going back to 1950.