Putting a bow on December 2018

The new year is a great time to take account of things in life.  We look at the year just ended, reflect on our successes and failures, decide how this year will be better, make our resolutions, and take on the new year.

I was all prepared to write a few posts on all that, but then the tidal wave that was December 2018 hit.  I posted last week right at its depths, but even the craziness of the last few days of the year require, neh demand, its own post.  So let’s put a bow on that crazy month.

As bad as it was . . .

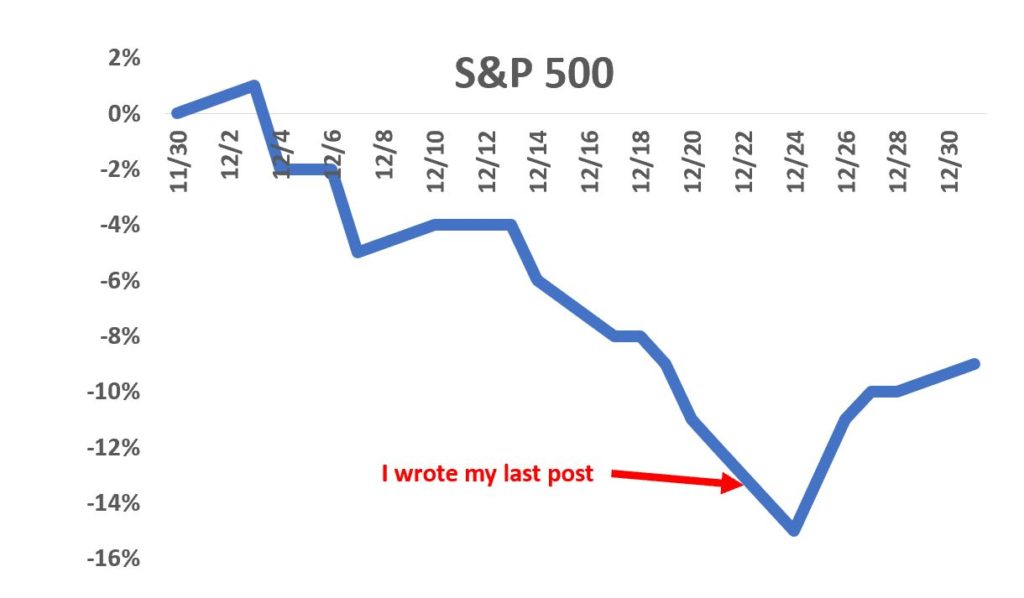
I posted last Monday, Christmas Eve, that with a bit over a week to go, December 2018 had already become the 4th worst month in the 69-year history of the S&P 500.  Going into that trading day, we were down 12% for the month, and then in an act worthy of Old Testament God, the market plunged that day another 3%.  Just in time for the holiday.  Thanks a lot.

It was bad and we were in the teeth of an all-time bad stock market plunge.  If you think of it as the 4th worst (or 3rd worst after that Monday) month in almost 70 years, you’d expect something like this once every 25 years or so.  That’s a generational storm.  Batten down the hatches.

. . . and how it ended

But there’s a reason that December ends after the 31st day and not the 24th day.  The day after Christmas (obviously markets were closed for Christmas), the markets increased 5% which is a crazy high amount.

Before we look at the larger picture, let’s just reflect on December 26 for a second.  It was the largest point gain day for both the S&P 500 and the Dow Jones Industrial Average.  Also, it was the 18th largest percentage increase for the S&P—top 18 out of over 17,000 trading days since 1950.  Not bad.

Back to the story, so Wednesday there was a big recovery but we were still down a lot.  But the market kept chugging along each day, and it ended the month up 7% for the lows on Christmas Eve.  Let’s not fool ourselves.  It was still down 9% for the month, but compared to where we were as Santa was loading up the sleigh, that’s not that bad.

In fact, while there’s no doubt that December 2018 was a bad month, it didn’t even rank in the Top 10 worst months of all time (it was at 11).  Not that that should make you feel good, but we were thinking we were being hit with a generational storm, and it ended up being an every 5 or 6-year storm.  Those things happen.

The stock market is a very complex human experiment, but in a lot of ways it’s very simple.  I think the crazy roller coaster ride in the month of December (and more broadly all of 2018) really illustrates this.  Things are never as bad as they seem, and the best strategy is usually to just sit tight and let the craziness work its way out of the system.

I hope everyone has a wonderful Christmas and New Year.  Next up you’ll see how the Fox family did on their investments including the wins and losses, so makes sure you have a box of tissues.

A month of freefall

Holy Crap!!!  I was all set to do a post on Fidelity’s zero-fee mutual funds as a follow up to last Wednesday’s post on index mutual funds.  But the stock market has had other ideas.  So far this month stocks have tumbled 12%.  12!!!

There seems like a lot going on that we need to process, so let’s start breaking this down.

Dec 2018 in context

There’s still a week to go, but as it stands right now, stocks are down 12% for the month.  Of course there’s one more week left in the month so things could go up and it won’t be as bad, or things could get worse and . . . well, let’s try to stay positive.

No matter how you slice it, 12% is a lot.  Just to put it in perspective, since 1950, when the S&P 500 started, there have been 828 months, and Dec 2018 ranks as the 4th worst month of all time.  In 70ish years we’re in the midst of the 4th worst month. 

Think of this as a generational storm.  I don’t know if that’s comforting or dispiriting.  Months like this happen, and it has been worse in the past, yet this is on the Mount Rushmore of all-time bad investing months.

Just in case you’re wondering what the 10 worst months for the S&P 500 are, here you go:

Month ending S&P 500 close Return
Oct-87 252 -21.8%
Oct-08 969 -16.9%
Aug-98 957 -14.6%
Dec-18 2417 -12.4%
Sep-74 64 -11.9%
Nov-73 96 -11.4%
Sep-02 815 -11.0%
Feb-09 735 -11.0%
Mar-80 102 -10.2%
Aug-90 323 -9.4%

Sit tight

What’s done is done.  The stock market has cratered, and unless you have a time machine, you just need to accept this really tough month and then look to the future.  That’s where I think things get a lot more comforting.

You can take that table above and then add two additional pieces of data: how stocks did in the next month and how stocks did over the next year.  That paints a completely different picture.

Month S&P 500 close Return Next month return Next 12-month return
Oct-87 252 -21.8% -8.5% 21.1%
Oct-08 969 -16.9% -7.5% 15.6%
Aug-98 957 -14.6% 6.2% 29.8%
Dec-18 2417 -12.4%
Sep-74 64 -11.9% 16.3% 13.5%
Nov-73 96 -11.4% 1.7% -28.3%
Sep-02 815 -11.0% 8.6% 12.4%
Feb-09 735 -11.0% 8.5% 38.4%
Mar-80 102 -10.2% 4.1% 28.0%
Aug-90 323 -9.4% -5.1% 29.2%

Who knows what will happen in January 2019 or the next 12 months, much less the next week (I certainly don’t).  Yet if you use history as a guide, there’s a lot of reason for optimism.

Of the 9 months that made the top 10 that we have data on, 6 of those 9 month saw gains in the stock market the next month.  I would definitely take an even-money bet that January 2019 will be a up month.  But by no means is it a sure thing; look at Oct-87 and Oct-08, the two worst months.  Those were followed up by brutal months.

Things look even better if you push the time horizon out from one month to a year.  For those 9 really bad months, if you looked at the market a year later, things looked good, really good.  8 of those 9 examples saw the market up, and all of those up years were up double digits.  They made up for the bad month and then some.  Of course, November 1973 shows you that’s not a certainty, but the fact that almost 90% the time things recover fully makes me feel pretty good.

What’s going to happen?

As I was doing the research for this post, I was struck by the examples of those really bad months.  Some of them are explainable while others are a bit odd.  October 1987 was Black Monday; October 2008 and February 2009 were the Great Recession; September 2002 was the popping of the Dot Com bubble;and November 1973, September 1974, and March 1980 were all a part of the Stagflation lost decade of the Nixon and Carter debacles.

Those others are a bit odd in that there really wasn’t a powerful reason that has survived the test of time.  I am sure you could look it up, but off-hand I couldn’t tell you what happened in August 1998 or August 1990.  Things were going well and as you can clearly see, a year later that bad month was a distant blot in the rear-view mirror.

I feel like that is what we’ll think of for December 2018.  By all measures things are going well for the economy.  The economy seems to be growing well, unemployment is low, and inflation is tame (between 2-3%).  Those are generally the Big 3 that you look at to see how things are doing, and they all seem okay or even better than okay.

That’s not to say there aren’t risks.  Of course there are, but there always are.  Brexit seems like it will have a rocky landing, the trade war between the US and China looms large, Trump pulling troops out of Syria might destabilizing, sovereign debt continues to pile up, and on and on and on.  That’s true now but there were other “risks” you could have sighted for any of those other Top-10 bad months.  I don’t think things are particularly worse now.

As always, I am optimistic about the stock market.  I think this month will be similar to August 1998 or August 1990 in that the statistics show it was a bad month, but people can’t really tell you much about it because it was in the midst of good times. 

That said, I do think there is the potential that we might be in for a couple lean years, maybe of the +/- 5% variety.  Over the past 5 years, since 2013, the market is up 70%, so it doesn’t seem unreasonable that we’re “due” for a bad year or two.

Mutual fund management fees: the silent killer

“If you have to ask how much it costs, you can’t afford it.”—JP Morgan

Imagine that you’re going to buy something that costs over $1000, maybe a flat-screen TV or a new set of tires for your car.  At some point during your decision-making process would you ask how much what you were getting costs?  Of course you would.  Unless you’re JP Morgan, a normal person figures out what something costs before he or she buys it.

Yet that is exactly what happens when people invest their money in mutual funds; they have no idea how much they are paying the mutual fund company to invest their money.  I guarantee you ask 100 people who have 401k accounts how much they paid in management fees last year, and less than 5 will know, and those 5 would probably just get lucky.  Even humble Mr Fox couldn’t tell you how much I pay Vanguard each year in management fees(important statement so I had to revert to third person), and I’m obsessed with this stuff.

And the crazy thing is with investing there are so many unknowns and random events, namely how your investments are going to do in the future, but one of the things we can control, how much we spend on mutual fund management fees, receives so little focus and attention.

Why are management fees swept under the rug?

First, investment companies have every incentive to hide the fact that these even exist.  Obviously,if Vanguard or Fidelity or American Funds can convince naïve investors that there’s no charge for investing their money, they’re more likely to do it—that’s economics 101.  SEC rules require that funds publish their management fees, yet they tend to be in the smaller print, much less conspicuous than the proclamation that “Our fund has beaten its comparable benchmark 7 of the last 10 years, before fees.”

Second, the amounts tend to seem small.  An actively-managed mutual fund with really high fees could be in the 1.5% range while a really large index mutual fund might bottom out at less than 0.1%.  That spread of 1.4% from high to low may not seem like a lot on its surface, but that’s a 15x range.  Also, due to the magic of compounding, over time, those fees would really add up.  That difference in management fees could lead to a 13% difference in a person’s nest egg; that’s the difference between someone with high expenses having $500,000 in their 401k after a 30 year career and $565,000. That’s real money!!!

What are the key determinants in how much a mutual fund charges for fees?

The single biggest factor in how much a mutual fund charges in management fees is whether it is a passively managed index fund or an actively managed fund.  Index mutual funds don’t require much oversight.  They find the index they want to mimic, like the S&P 500, then they have a computer program that monitors the fund’s holdings and makes small course-correction trades to ensure that the composition of the fund is as close to the index as possible.  You have a couple people make sure the computer doesn’t go crazy and you’re set.  There are still costs like accounting,marketing, keeping the website up, sending out account statements, etc., but it’s a pretty lean operation.

Also, with index mutual funds, in many ways they’re a commodity.  Any S&P 500 index fund performs 99.99% identically to any other; that’s the very essence of an index mutual fund.  So if there is no difference in the product, then companies must differentiate on cost.  Not surprisingly, what is largely considered the best S&P 500 index fund (if you count it in terms of amount invested)is the one with the lowest costs: the Vanguard S&P 500 Index (VFINX).

Now on the complete other end of the expense spectrum you have the exorbitant fees associated with actively-managed mutual funds.  There are mutual fund managers who get six-,seven-, and sometimes even eight-figure compensation packages.  What justifies such astronomical pay?  Just like free-agents in baseball these fund managers who are perceived as the best can go to the highest bidder, becoming celebrities in their own right (see: Lynch, Peter). 

Beyond the compensation for the fund managers, these funds have a lot of costs.  There are all sorts of industry and trade conferences that fund managers go to.  And if you think they fly coach and stay at a Holiday Inn, I have a bridge to sell you. They work in glass palaces in downtown Boston and New York.  Let me just say I once went into Fidelity’s headquarters in Boston and to quote a line from one of my favorite investing movies, Barbarians at the Gates, “it makes Buckingham Palace look like a Burger King.”  Many offer gourmet lunches to their staffs every day, limos, in-house massage therapists, and the list goes on, but you get the point.  And where does all this money come from?  It comes from the extra 1.4% difference in management fees between an actively managed fund and an index fund.

Where can you find the information?

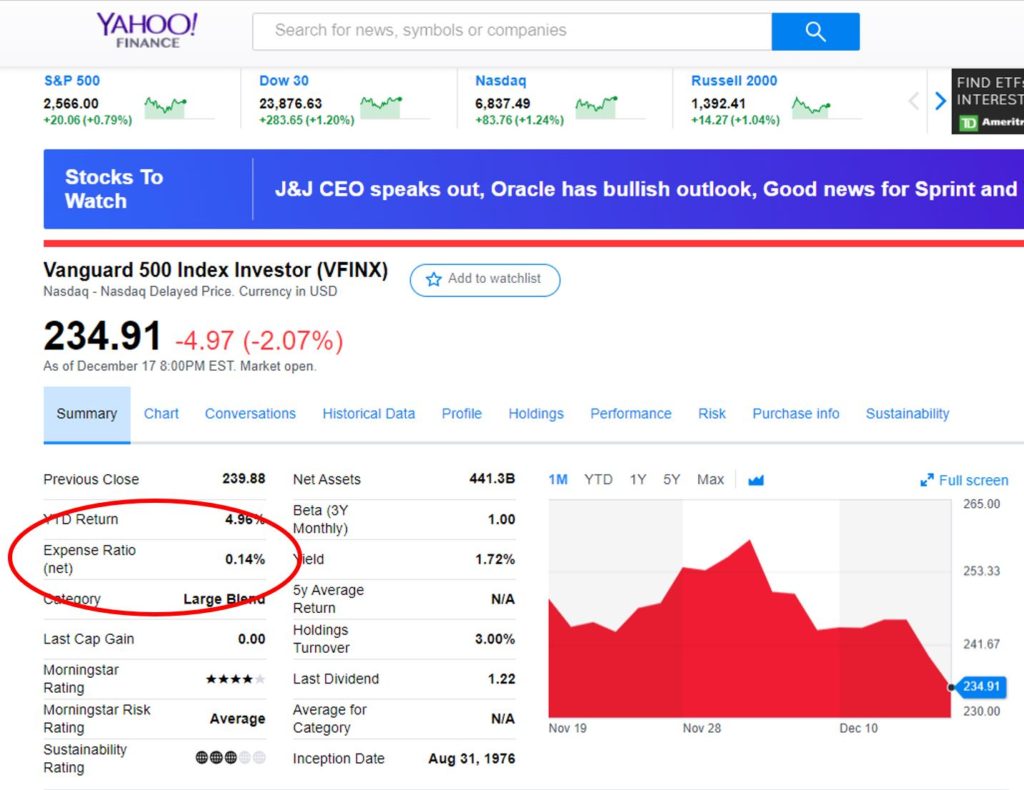
This fancy thing called the internet actually makes this pretty easy to look at. Pretty much every finance website (Google,Yahoo!,etc.) lists every mutual fund’s expense ratio. This allows comparison shopping to be really easy.  In about 5 minutes you could look up and compare the management fees of any of the mutual funds you are considering.

You can see the expense ratio circled in red on the left.

That’s not to say this is the only factor you should consider when choosing a mutual fund. That’s some deep water which would be a great topic for another post,but it is a really important one.  Some would even argue that it is the single most important factor.  Sadly it’s one that very, very few people are knowledgeable of.  As you look to build your nest egg, it’s something you should absolutely know when you start making your investment decisions.

For our money, the Fox family is a believer in index mutual funds.  In fact, 100% of all our money is in index mutual funds, so this is no joke to us.  The management fee varies for each fund,management fees for US funds tend to be a little higher than international funds, but the range is about 0.05% to 0.20%, with the average coming in around 0.08%.  So we are paying 0.08% of our total nestegg each year in management fees.

That’s what I do, but that doesn’t mean you have to do the same.  There are many vocal proponents of actively managed mutual funds (by buddy Mike from Boston).  Their points become especially compelling at times like this when the market is going down.

Believe what you will, but if what ever type of mutual fund you invest in you should always know what you are paying.  After all, you aren’t JP Morgan.  If you are paying a high management fee, just make sure you are getting your money’s worth.

Will you lose money with stocks?

I’m trying to build my audience, so if you like this post, please share it on social media using the buttons right above.

This is probably the most common question you get from people who are considering starting to invest in stocks.  It’s pretty understandable; you work hard for your money and the idea of it disappearing into the black hole of an unpredictable and often times not-well-understood stock market is pretty hard to stomach.  Add on that scars from the 2008 Great Recession, 2001 Internet Bubble, Black Monday in 1987, Black Tuesday in 1929, and on and on and on.  Even recently, 2018 has had a bunch of wild freefalls, including the one we’re in right now.

So, what’s the answer to the question:  Who knows?  The stock market is unpredictable and no one knows what will happen in the future.  That’s not an especially satisfying answer, but it’s the truth.  If I could predict the stock market I would own my own island in the Caribbean next to Johnny Depp’s.

But I can hear you saying, “Come on, you’re Stocky Fox.  You can do better than that.”  You’re right.  I’m taking on the challenge and answering the question: Will you lose money with the stock market?

I won’t try to predict what will happen in the future, but I think you can look to how things have behaved in the past, and get a pretty good perspective.  Of course, there’s no certainty that the future will be like the past, but that’s the best we have to look at.

You can get somewhat decent data on the stock market going all the way back to 1871.  Back then, your great-great-great grandmother was getting The Stocky Fox as a newsletter delivered by the Pony Express.  Going that far back, you can calculate the percentage of the time that you would have lost money investing, historically.

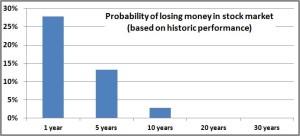
So imagine starting in January 1871 and investing $10 every month in the US stock market.  By January 1872, you would have invested a total of $120 and your stocks would be worth $128; congratulations, you just made a profit.  You can do that for every 12-month period since 1871 (there are about 1700 such periods), and you come out ahead 71% of the time, which seems pretty good.  But the flip side is that you’d have lost money 29% of the time, and at least to me that is too high to be really comfortable.

Chart for losing money

However, remember that when investing stocks, time is on your side.  Do the same exercise but for five years; if you started in January 1871 after 5 years you would have invested a total of $600 which would be worth $679 in January 1876 (yeah, profit again!!!).  Do that for every five-year time period and you end up losing money only 13% of the time.  By adding another four years to your investing time horizon that decreased the chances that you would have lost money by 20%!!! That seems pretty amazing.

You can keep doing that for longer time periods, and as you could guess, the percentage of times you would have lost money keeps going down.  Astoundingly at the 20-year mark, you would have lost money only one time out of the nearly 1500 periods possible (the one month was June 1912 which, you guessed it, was 20 years before the Great Depression bottomed out).  At 30 years, there isn’t a single time period where consistent investing would have lost money!!!  That’s not a misprint.  Read that paragraph again.

There are no guarantees, but if you use history as a guide, it’s pretty much a sure thing that you’ll make money in the stock market.  Certainly it involves a lot of discipline, investing month after month no matter how bad things look (dollar cost averaging).  Also, it doesn’t necessarily mean you always make a lot of money, but the data seem pretty powerful.  Additionally, I didn’t take inflation into account so that would definitely skew the numbers downward (but you know how I feel about the integrity of the data on inflation, so there you go), but the message remains largely unchanged.

I must confess that I was a bit surprised by the data.  Actually, I spent about 30 minutes going through the spreadsheet to see if I made any mistakes; I’m pretty confident the analysis is sound.  As Dr Brown asked Marty in Back to the Future, “Do you know what this means?” (just don’t take what he says after that and apply it to my analysis).  If your time horizon is 20 years or more, at least based on history, there’s virtually no chance that you’ll lose money.  I figured it would be a pretty low chance, but zero chance?  I didn’t see that coming.  Even people who invested for 20 years then pulled out after the Great Recession in 2008 did fairly well (invested $240 which became worth $339).

So there you go.  My answer to the question posed at the top is still: No one knows what the future holds.  But the historic data confirms my personal belief that the stock market is a really great place to invest your money.  I lose no sleep worrying about the Fox family’s investments increasing in value.  I know over the long term they will.

Light at the end of the tunnel for Bitcoin?

Last year about this time, the nation was gripped in Bitcoin-mania.  It was dizzying.

As with most bubbles, it transcended financial markets and wormed its way into the mainstream. Everyone was talking about it, from late-night talk show hosts to grandmothers and everyone in between.

I wrote my thoughts on the matter here.  Just after that post, Bitcoin rose another 10% and then cratered precipitously.  I predicted its decline would result from it being connected to a terrorist attack and world governments using that as a pretext to extinguish it.  As it happened, it just seems that the bloom fell off Bitcoin’s rose.  Sometimes financial markets are fickle.

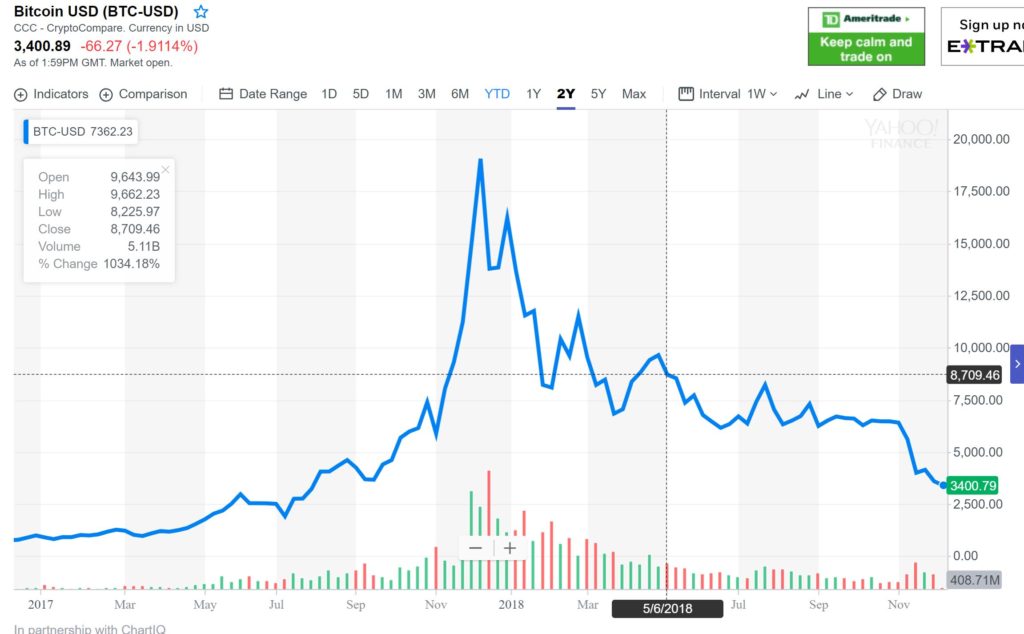
In 2017 Bitcoin rose from about $1000 to a peak of almost $20,000.  As fast as the rise was, the fall has been nearly as fast; from $20,000 to about $4000 today.  But this post isn’t a victory lap—Bitcoin bears were clearly proven right, so what’s the point of adding on there?

The point of this post is to give a little bit of love to Bitcoin.  I wouldn’t say I’m making a bullish bet on Bitcoin (I certainly haven’t bought any, and have no plans to).  However, here is an argument why it may not be doomed.

You can actually buy stuff

The biggest problem for Bitcoin was that it had no intrinsic value.  That’s not a deal-breaker: fiat currencies (dollars, euros, yuan, etc.) are only valuable because their home countries say they are and pass laws that you can use those pieces of paper to pay for stuff (more on this in a second). 

Without that government backing, Bitcoin becomes a bit like gold or diamonds, inherently worthless pieces of stuff but are valuable because enough people in the world think they are valuable.  Of course, a big difference is that you can hold gold or a diamond, but not so much with Bitcoin.

In December 2017 enough people thought Bitcoin had value that it pushed the price to $19,000. Today, many fewer think it is valuable so it’s worth much less, hence the $3400 price.

Through it all, Bitcoin was missing a major component of a currency (like a dollar) or even a store-of-value commodity (like gold)—you couldn’t buy anything with it.  I don’t think you would have had near the crash (and probably not the run-up either).

Until recently, you could only buy stuff with Bitcoin on the fringes of the economy.  Certainly, the black market accepted it, but that’s not exactly what we’re going for.  A very small handful of regular stores(virtual or brick-and-mortar) did, but that was minuscule.

That may be about to change in a profound way.  The state of Ohio recently announced that you can pay your taxes using Bitcoin. It’s hard to understate the importance of this.  Paying taxes, by definition, is about as legitimate a transaction as there is. All the sudden Bitcoin is a legitimate currency, at least to the state of Ohio.  To compound the point, I don’t believe you can pay your taxes in Ohio in euros or yuan (undeniably currencies)or gold or diamonds (undeniably stores of value).

How will this impact Bitcoin’s price

Now that Ohio will accept it, that will create a real market for Bitcoin.  That begs the question,what will that do to the price?  You should expect my normal answer: I have no idea. But I do have some thoughts.

Bitcoin’s price has been in freefall for months now.  This was caused in large part by the tiny, tiny issue of Bitcoin not being used anywhere. Now that has changed.  I still think Bitcoin could go down, but I definitely think it will not go down as much as it would have if Ohio hadn’t made it’s decision.  It’s impossible to know if I’m right or wrong on that, since we can’t test things in alternate dimensions.

It’s not to say Ohio is getting in the Bitcoin game.  It just takes the Bitcoin payments, sends them to a market to get exchanged into dollars, and they have their money.

Ohio has taken the first step and it’ll be interesting to see if any other states follow suit.  If a large state like New York, Texas, or California also starts accepting Bitcoin, I think that will definitely buoy it’s value as it becomes even more of an accepted currency.  And of course the coup d’etat would be the Federal government accepting it.

Overall, I still think Bitcoin will be volatile, probably to the downside.  However, I do think maybe we’ll back in five years when Bitcoin has settled to something of value,probably less than $4000, and look at this Ohio decision as the first step towards that stabilization.

My story about selling commodities

A few years ago, I wrote about our worst investment of all time—commodities.

I think this is a classic case of deviating from the tried and true rules that you only need three investments in an effort to get creative and get higher returns.  In general you should always resist that siren song.  It cost us well over $100,000; that’s an expensive lesson.

After a few years of crapping performance, I finally bit the bullet, admitted defeat, took a huge loss, and sold my commodities.


Examining the wreckage

We starting buying commodities ETFs (ticker symbol DJP) in 2010 in small increments, and continued that through the end of 2014.  When all was said and done, we had invested a total of about $100,000.  By the time we sold, those ETFs were worth about $65,000, so we lost $35,000.  Ouch!!!

But that’s only a small part of the loss.  I knew, I KNEW, that we should invest that money in stocks but we didn’t.  Had we invested that money in a stock index fund that $100,000 would have grown to nearly $200,000 by the end of 2017.  I just threw up in my mouth.

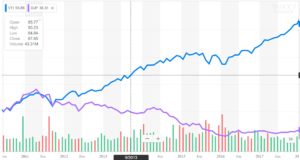
A picture says a thousand words–the purple line is commodities for the period we owned them; the blue line is US stocks. OUCH!!!


This is a boneheaded mistake for the ages.  Of course, as in most things in life, when you realize you made a mistake like that you need to move on.  With stocks that’s tough psychologically to do because not only is it admitting failure, but it’s also locking in those losses.  So long as you keep the investment you can always tell yourself there’s a chance that things will turn around.

Finally at the end of 2017, to take advantage of a little tax loss harvesting, I sold all our commodities investments.  That horrendous chapter of our investing history was over.


Investing gods decide to humble me further

What unfolded was a story similar to one of those stories from the Bible where God continues to test someone’s faith.  I sold all our commodities investments and invested them in US stock investments.

By the end of April 2018 commodities were up about 2% for the year while stocks were down 2%.  ARE YOU KIDDING ME?  After 7 years of stocks drastically outperforming commodities, the trend reversed right after I sold out my commodities.  As you might guess, I was feeling picked on by some power beyond my understanding.

I kept to my guns and my faith was rewarded.  By the end of August 2018, stocks had a big rally (up 8% for the year) while commodities were crushed (down 7% for the year).  When all is said and done, stocks are up about 2% while commodities are down 5%.  That difference equates to about $4000 in my favor.


There are a couple things I took away from this:

First, as an investor, you have to focus on the present and future, and not cling to the past.  Second, sometimes your investments work out and sometimes they don’t, and you can’t get paralyzed by your investing failures.  Third, exotic investments generally don’t work out over time.

All these really combine to illustrate all the things I did wrong with commodities.  I should have just stuck to investing in stocks as I always preach on this blog.  Once it started going bad, I should have cut and run instead of clinging to something in the hope that it would “come around.”

Better late than never.  While I definitely left over $100,000 on the table, at least I didn’t leave that last $4000.  That’s what I tell myself anyway.

Top 5—investing moves when you’re just getting started

My neighbor’s son, Rhino, just got engaged (I dubbed him rhino because the rhinoceros beetle is the strongest animal in the world pound-for-pound, and this kid is really strong).  We’ve gotten to Rhino over the years.  He was Mini and ‘Lil Fox’s first babysitter when we moved into the neighborhood, so of course he has a special place in our hearts.

We were talking about his engagement, starting out life, and obviously since it’s a conversation with me, how to do the right things financially.

It got me to thinking about what are the most important things to do in the world of personal finance when you are just getting started.  For the soon-to-be newlyweds, here is my Top 5 list:


5. Figure out your debt situation: If you’re lucky, you won’t have a lot (or any) debt.  For most of us there is some out there, and that isn’t necessarily a bad thing.  List out every debt you have (student loan, mortgage, credit card, car payment, etc.), the balance, and the interest rate.

On a spreadsheet (see #4) rank them in order of interest rate.  As a general rule I use a cutoff of about 6%.  If your interest rate is above that pay those off right away, starting with the highest interest rate debt first.  If your interest rate is below that, that might be okay to keep that debt and just make the normal monthly payments.

If you have any debt (especially credit card debt) at any rate higher than 10%, that’s a “debt emergency”.  Really look at every purchase you make—if it’s not critical to your survival (food, shelter) then pass that up until your debt is paid off.  The only exception to this is #1—funding your 401k.

You can get creative with your debt by consolidating high interest rate cards onto a lower rate card or one that offers a low teaser rate.  That could save you a ton of money, and you should probably look into that, but ultimately, you’ll need to pay that sucker off.  So just hitting the grindstone of paying off your credit cards is a must.


4. Make a budget on a spreadsheet: Take a spreadsheet and put a quick budget together that includes your income, your expenses, and the difference between those two.  This can be simple at first (and it should be simple at first).  Over time, you’ll add more and more sheets to the spreadsheet for things like your mortgage, investments, kids’ education, and other things.

But at the beginning, you need to get a sense of where your money is going.  The budget will give you an aspirational view of this.  After your budget is done, you can track your spending with a website like mint.com.  This two-step process lets you figure where you want to spend your money, and then also look at where you actually spend it.

Of course, this is an iterative process, and as you close a month and look at your expenses, you can see if you’re spending more than what you budgeted.  This isn’t a time to beat yourself up (being too hard on yourself is a sure way to stop looking at your finances closely, and that’s a REALLY bad thing), but a time to ask yourself why you spent more and if it was worth it.

As an aside, using a spreadsheet is a really good skill in general.  I was really good at spreadsheets and it’s hard to overstate the incredible impact it had on my career, as well as the incredible wealth those skills gave me and my family.  And really, my experience with spreadsheets started in college when I was creating a financial budget.


3. Educate yourself on investing: At a young age, educate yourself on investing.  Obviously, this blog is the universally acknowledged best place to learn about investing, but I have heard rumors there are others.

www.mrmoneymustache.com is a great website that looks at personal spending and his early posts had a tremendous impact on my outlook.  A Random Walk Down Wall Street is a book on investing that really defined my investing strategy; I read that as a 19-year-old and still think about its insights today.

There are a lot of websites written by millennials about spending and personal finance that might resonate even more.  A few are: millennialmoneyman.com, moneypeach.com, and brokemillennial.com.  Most are about reducing spending and budgets and that sort of thing, but there are some on the nitty gritty of making investing choices.  You’ll want perspectives on both.

The whole point is that you need to know what you are doing here.  Spending 20 hours early in your life to figure out basics like asset allocation, tax avoidance, and fee minimization as well as a general attitude towards saving early can easily lead to hundreds of thousands or millions of dollars.  That comes to about $50,000 per hour—not bad.


2. Start an IRA with $1,000: This is as much about the experience gained as it is about actually investing your money.  Vanguard lets you start an IRA with $1,000 as the minimum amount.

You’ll navigate through their website, figure out how to make choices (like Roth or Traditional IRA—go traditional).  You’ll pick your investments, and then you’ll have something to look at every once in a while to see how it’s doing.

So many people are just at a total loss when it comes to setting up accounts for their investments.  That becomes a real problem once you hit 30 or 40 and you’re starting to get behind the 8-ball; you know you need to do something but are kind of clueless on where to start.  Doing it now lets you get your toes wet in this world and makes the next accounts you need to set up (529, 401k, brokerage, etc.) all the less daunting.


1. Get the company match on your 401k: #2 was more for experience than for investment.  Here is where you should start walking down the path for investments.  At a minimum, contribute the match and take the free money.

This is so important for a couple reasons.  First, you’re getting that free money.  Second, you’re making your first “asset allocation” decision.  When it comes time to pick which fund to invest in, unless you have very unique circumstances for an early-20s person, I would definitely go with a 100% equity index fund.

Third, your 401k is a really powerful tool.  If you had no other investing tool, you could still grow a 401k to well over a $1 million during your working career.  That is enough to fully fund your retirement.


BONUS—Stay poor:  Too many young adults make a huge mistake of trying to mimic the lifestyle their parents provided, once they (the young adults) get out of school.  That first paycheck of $2,000 is going to seem like a ton of money (and it is).  It’s really tempting to decide to buy a new car or go on a kickin’ vacation or upgrade the furniture.  Resist the urge.

Your parents took 25 or more years of working (with pay increases and investment returns) to provide the house and cars and vacations you enjoyed your senior year of high school.  It’s not realistic to think you can have stuff at that level of niceness so early.

A car is a really good example.  In general, automobiles are horrible investments.  To the degree you have a car that can get you from point A to point B, keep it.  A new car will be nice and cool and make your friends gawk, but it’s a horrible use of money.  A couple hundred dollars a month for a car, plus insurance, and maybe $50 for a gym membership, $50 for cable, and $80 for four dinners at a restaurant—those numbers add up.  Those alone could fund your savings in the early years.

Your early 20s are a time when it’s still okay not to have the best and nicest of everything.  If you can embrace that, even when you do have the money, and put that extra money to work in investments you’ll build a very strong financial foundation that will afford you many more opportunities are you reach your 30s and 40s (remember, I did that and I retired at 36).

Tax loss harvesting

The US has a complex tax code.  That means people are always looking for ways (hopefully legal) to reduce the amount they owe in taxes.

Tax loss harvesting is one way you can do just that.  The option isn’t always available; you need to have investment losses which means you can only do it in years the market is down.  Through November, US stocks were slightly down for the year while International stocks were down significantly.  That created the situation where you might be able to do some harvesting.

There are some intricacies with the tax law here.  Remember that I am not an expert, so if you do this, you may want to consult a tax professional.


What it is

We all know that when you make money in the stock market (sell stock for more than what you bought it for), you are taxed on that gain.  That’s called a capital gain.  The opposite is true for losses; when you have a loss (sell for less than what you bought it for), you can reduce your taxes.  Wait for it . . . those are called capital losses.

Tax loss harvesting is selling some of your investments at a loss, and then using that capital loss to reduce what you owe to the government in taxes.


How to do it

The strategy is pretty simple.  When markets are down you can sell some of your investments at a loss.

Then at the end of the year, you can claim that loss on your taxes.  The loss will offset any stock gains you have (either capital gains or distributions/dividends).  If you still have losses after those have been offset, you can reduce your taxable income by up to $3000.  That last part is a pretty sweet deal, especially if you are in a higher tax bracket.

Tactically, you just go to the website with your accounts (www.vanguard.com or www.fidelity.com or where ever) and sell those investments which have a loss.  The in April when you pay your taxes, you get the tax forms from your brokerage house, and put those in your tax forms.  Easy.


Why it’s important

The major benefit is that you are reducing your tax bill . . . now.  Notice how I said that.  Ultimately, you’re doing all this to lower your tax bill now and have it increase at some point in the future.  Make no mistake, at some point or another you will need to pay taxes on your gains, it’s just a matter of when.

Obviously, having more money now instead of giving it to the government is a good thing, even if you’ll have to give it up later.  Beyond that, there is the potential to create real dollar savings instead of just delaying when you pay taxes.

Capital gains and qualified dividends are taxed at three different rates, depending on your income.

Income (for married couple) Tax rate
$0 to $77k 0%
$77k to $600k 15%
$600k+ 20%


If you can use tax loss harvesting to influence when you pay taxes on those capital gains, there is the potential to recognize them when you’re in a lower tax bracket.

For Foxy Lady and me, we are in that middle tax bracket, so we would pay 15% on any capital gains and qualified dividends.  However, if we did harvesting now and then recognized those gains in a year when our income was lower (below that $77k threshold), it’s possible that we could lower our rate from 15% to 0%.  That’s real savings.


Doesn’t that defeat the purpose of investing

When you tax loss harvest you’re selling your investments, obviously.  That could lead to another problem that you’re pulling your money out of the market, and you’re pulling your money out when stocks are down which seems like the absolute worst time.  Likely you don’t want to do that; certainly, all other things being equal, pulling your money out at a loss isn’t what we’re going for with investing.

Actually, you can just trade your investments.  So you can sell mutual fund ABC at a loss and simultaneously use those proceeds to buy mutual fund XYZ.  You get the benefit of the tax loss but stay in the market.

The IRS understands this and has rules.  You can’t sell ABC, recognize the loss, and then immediately buy back ABC.  You have to wait 30 days to do that round trip.

However, you can buy something similar.  The IRS says it can’t be too similar, but they don’t strictly define that so it’s a gray area.  I personally, think it’s fair game to sell a broad mutual fund and buy another that is similar but still different (maybe a total international mutual fund gets sold and a total world mutual fund gets bought).  You are still fully invested and largely have similar exposure, but you get that tax loss which is the whole point.


I don’t think this is something that is going to make you rich (like asset allocation or lowering fees—those strategies will make you rich).  But it could net you a couple hundred or maybe even a couple thousand dollars.  Who says “no” to that?

Top 5 investing highlights from 2018

We’re all getting used to me going for extended periods without writing a blog post.  I’m sorry about that, but I’ve had a consulting job for the past couple months that has been keeping me busy.  It’s starting to wind down, so I should have more time to consistently write posts.  As always, thank you for sticking with me.


Wow!!!  It’s been a crazy few months in the stock market since I’ve been gone.  I figured for my first blog back I would give you my list of the craziest/most interesting things to happen in the investing world the past few months.  Some of these deserve their own post, so we can dive deeper into those in future posts.

Without further adieu, here are my Top 5 investing highlights since April:


5. Interest rates on the rise: 2018 has been the year of the interest rate increase by the Fed. In response to the 2008 financial crisis, the Fed cut interest rates to nearly 0%.  There they stayed for nearly the entire 8 years of the Obama administration.  It was only in December of 2015 that the interest rate was raised to 0.5%.

Since 2015, there have been 7 rate increases (including 3 so far in 2018), bringing the Fed rate to 2.25%.  This stuff makes finance nerds giddy, but it does have real-life impacts on the rest of us.

I think the biggest direct impact is that mortgage rates have started to go up.  Now a 30-year fixed mortgage is at about 5%.  A couple years back it was at 3.5%.  That’s a major change that could mean hundreds of dollars per month on a families mortgage.  This impact stretches to housing affordability (gets worse) and number of families refinancing (goes down).


4. Massive tax law passes: I know the big tax law passed in December 2017, but I feel a lot of the ramifications hit in 2018. By mid-year it seemed the impact was starting to hit the market—GDP growth was higher than it had been in a really long time, unemployment was lower, and because of the low unemployment inflation had kicked higher.

The immediate impact of the tax break had a major boost to the markets in late December and early January.  Then there was a huge market drop in late January and early February.  However, it seemed that the benefits of the tax breaks (higher GDP, lower unemployment) started boosting stock, with the US markets hitting all-time highs in September.

Obviously, since September stocks have been on a major slide, but we’ll leave that for reason #1.


3. US elections in November: Politics are different from investing, but obviously they are connected. The soap opera that is Washington DC hit a fever pitch on November 6, with an unusually high amount of drama for a off-election.

Republicans increased their majority in the Senate, while Democrats gained enough seats in the House of Representatives to take over that chamber of Congress.  The headline was obviously that the US would have a split government for the next two years.

Pundits spent innumerable hours debating the impact split government would have on the nation broadly and the investing markets in particular.  The common thinking is that split government is a good thing in that government can’t make major changes, giving some level of predictability for business.  I tend to agree with that.  In fact, when you look at the data, the stock market does best with a split government.

In case you were curious, the market was up 2.1% the day after the elections, so clearly the markets liked the outcome of the election.


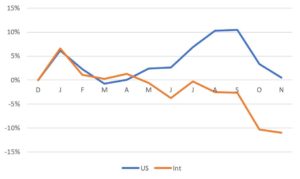
2. America is #1: I had a blog on this a while back, but I’m still fascinated by this phenomenon. As of now, US stocks are down 2.2% for the year while international stocks are down 14.2%.  That’s a 12% difference!!!  That’s huge!!!

Curiously, they stayed fairly coorelated all the way through April.  Then, starting in May, they really began to diverge.

The reasons aren’t entirely known.  Many people have many opinions, and I imagine this will be examined for years.  However, my belief is it’s a combination of the US winning the trade wars, China’s economy slowing down, and Europe figuring out Brexit and the future of the EU.

Who knows if I’m right or wrong.  But certainly this is interesting.


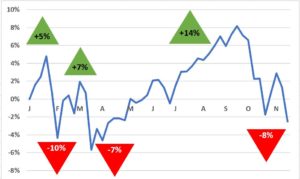
1. The rollercoaster that is the stock market: It has been a wild ride all of 2018.

January started out on fire, then the stock market took a huge dump in February, rallied towards the end of the month, fell again in March, then plodded out a 8-month upward march that peaked in September, and has since fallen to its current levels.

Those a 6 distinct moves, all of which are major.  I’ve talked about how I think volatility is becoming more inherent in the market, so I think that’s a piece of it.  But the change of directions this dramatic is definitely an unusual twist.

And we still have a month to go.  Stay tuned.

First half of 2018—much ado about nothing

I wanted to write a recap of the stock market in the first half of 2018.  It’s taken me a little while to get to it because I actually have a job that I’m working on.  Sorry about the delay, but here it is.


At first blush, you might think that the stock market has gone crazy.  I don’t know if you can objectively measure things, but it seems the media which has always been in a frenzy the past decade or so, has gone into overdrive lately.

Obviously there are the big rocks like: school shootings and gun control, the #metoo movement, the eternal Russia meddling probe, the North Korea talks, the retirement and impeding replacement of Justice Kennedy, and the separation of families of illegal immigrants.  There are probably more but those are top of mind.

Most of those are social issues, but they have major economic components.  The gun control debate will have a profound impact on gun manufacturers, many of whom are publicly traded.  #metoo has forced the resignation of several business leaders.  North Korea and Russia talks impact trade and possible war with mass destruction, which of course has a hugely negative impact on the economy.

And this misses the most exciting/depressing/entertaining news item (depending on your persuasion): President Trump.  He alone creates enough material to fill the 24-hour news cycle.


US Stock Market . . . happy yawn

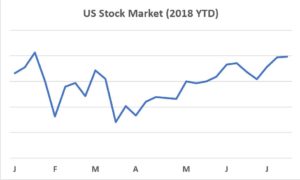
So with all this, what has happened with the stock market.  Despite a few gyrations, it’s been fairly stable over a long-term point of view.  It had a  great January (continuing the really strong momentum from 2017), and then things peaked.

There are a few important takeaways.  First, there were a couple huge drops at the end of January and the end of March, but we recovered from those fairly steadily.  Second, we are now at where we were when the stock market peaked in January.  Third, remember that all this 2018 performance is coming on the heels of a spectacular 2017.

All things considered, that seems pretty good.  The market is up 4% so far for the year.  Maybe that seems a bit dissatisfying because it’s been flat since the peak in late January, but up is still up.  Let’s not look a gift horse in the mouth on this one.


International Stock Market . . . interesting

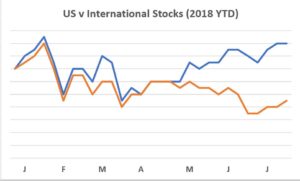
What I think is most interesting is that since May the US stock market has marched higher while international stocks markets have gone the other way.  Look at the chart for 2018 so far.

Most of the time, US (blue) and International (orange) stocks tend to move in sync.  Sure, there are always small differences, but by and large when one goes up the other does too and vice versa.  That was the story for sure for the first part of 2018.  Then something happened in May; since then US stocks have marched upwards about 6% while International stocks have fallen about 3%.  That’s a 9% difference!!!

I’ve racked my brain, and I don’t have a clear reason.  Sure, the North Korea situation continues to be goofy.  Italy elected an anti-immigration government that turned a boatload of refugees away.  Brexit unfolds like a car wreck in slow motion.  Syria, Russia, Venezuela—all the usual suspects.  But what has changed in the past couple months that has been so good for the US and so bad for the rest of the world?

The only thing I can really think of is the trade war Trump has initiated.  Typically in these there are winners and losers, so maybe the market is predicting that the US will “win” this and the rest of the world (especially the developing markets since those stocks are down the most) will “lose”.  There are a ton of complications and nuances and a million different things could happen, but that’s the best I could come up with.  I guess we all need to stay tuned.

Either way, what is going on right now with such a disparity in the performance of major stock indices is not common.


If you put that all into the pot and mix it, things have gone pretty well for the investor.  That seems a bit different from the constant news stories about how the world is on the brink of disaster, but that goes to show you that long-term investing washes away a lot of those shorter-term swings.

As always we are and have been fully invested in this stock market.