Emergency fund

As you might imagine, I talk to a lot of people about what they’re doing with their investments.  One of the things I hear a lot is, “I’d like to start investing, but before I do that, I need to build up my emergency fund.”  That sounds pretty prudent.  You don’t want to get caught in the lurch when life throws a curve ball at you.  Yet, I actually think this is a really bad move.  I freely admit that the Fox family does not have an emergency fund.  We have investments, and if the unforeseen happens that’s what we’ll use.


How likely is an emergency?

What are the types of things that you’d use an emergency fund for?  Almost by definition, an emergency is something that is unpredictable and somewhat rare.  If your 12-year-old Honda Civic is starting to die and you know in the next couple years you need to get a new one, that isn’t really an emergency as much as something you need to budget for (that was the exact circumstance of the Fox family a few years back).  If you’re having an “emergency” every year, either you’re the unluckiest of people, or probably  more likely you just have a lifestyle that needs to be budgeted a little differently.

When I think of things that you’d spend an emergency fund on it’s stuff like: your hot water heater gives out, you’re 7-year car gets totaled and insurance only gives you $6000 to get a new one, your son goes into the NICU for four days because of croup and your portion of the bill is $4000 (as happened with Lil’ Fox last year), or you are fired from your job.

As I was writing this post, I asked Foxy Lady if she could remember any emergencies that we have faced since we were married 7 years ago.  The hospital thing with Lil’ Fox was the only one we came up with.  There were smaller things like when we had to replace the dishwasher ($500) or fix the clothes dryer ($400), or fly back to Michigan for a funeral ($400), but the hospital thing was the only major one (I’m defining “major” as more than $1000).  So that means we have averaged one emergency every several years.  Once every several years—I don’t know if we’re more or less prone to emergencies than the general population, but that seems about right.

So be a little more cautious and use once every five years as an average—you have about a 20% chance in any given year of needing to tap into your emergency fund.  We’ll use that in a second.


How likely is it you’ll make money in the stock market?

Obviously we put a huge caveat on this, but we can look at historical performance to get a sense for how likely it is that you’ll make money or lose money if you invest your emergency fund in stocks.  Actually, we kind of did this in a post a while back.

Remember that historically, if you have a one-year investment time horizon, you make money with stocks about 70% of the time.  That is actually pretty good odds that investing your emergency fund in stocks would have you come out ahead, just looking at it for one year.  In fact, we can do the math, and the chances of you having an emergency in a given year and losing money in the market are about 6% (20% chance you’ll have an emergency x 30% chance you’ll lose money in the market that year).

But remember, emergencies don’t happen every year—they tend to be much less frequent than that.  For the Fox family, they happen on average once every five years.  Just for the fun of it I put a table together that estimated the chances of having an emergency if you assume in any given years there’s a 20% chance of having one.  Also, I looked at the historic data to see the probability that you would have lost money in the market over different time horizons.

Time horizon Chance of an emergency Chance of losing money in stock market* Chance of emergency and losing money
1 year 20% 28% 6%
2 years 36% 24% 9%
3 years 49% 18% 9%
5 years 67% 13% 9%
10 years 89% 3% 3%


As we mentioned above, there’s a 6% chance that in any given year you would need to tap your emergency fund when the market was down.  Looking at other time frames you get similar results.  Pretty much any time frame has a less than 10% chance of you needing that emergency money at a time that you would have lost money in the market*.  You need to decide if you’re willing to take that risk, but to me that seems like a no-brainer.  If I have a 90%+ chance of coming out ahead on something, I’m doing it.

You can see where I’m going with this.  First, emergencies don’t happen all that often (if they do, you probably need to come up with another name for them other than “emergency”).  Second, if you give yourself a few years in the stock market, the probability of losing money goes down a lot (of course, it never goes to zero).  That seems like a perfect combination for investing your emergency fund the same way you invest any of your other money.  $10,000 invested in stocks with an average return of 6% would give you about $13,300 after five years; keeping that same amount if your savings account at today’s interest rates would give you about $10,050.  Seriously, that’s ridiculous.

I get that many people look at that and say, “the whole point of an emergency fund is you never know when you’ll need it, so don’t put the money somewhere where you might lose it.”  That’s a very understandable concern, but it’s also where a lot of people are leaving a ton of money on the table.  Over the past 150 years, investing in stocks has a really good track record, and the more time you give it, the better that track record becomes.  You’ll never eliminate all the risk from investing, whether it’s your 401k or US bonds or the cash in your checking account, there will always be some type of risk.

It’s the successful investors who understand that risk and understand how to decrease the risk (expanding that time horizon to five years cuts in half the likelihood of losing money), that are able to get the most bang for their buck.  This is definitely one of those areas where you can get a 1% coupon.


The Fox family eats on our cooking on this one.  We don’t have an emergency fund.  When emergencies do happen like with Lil’ Fox, we pay for it out of our investments, absolutely believing that over our lifetimes there may be one or two instances where we lose money but there will be many, many more where we come out ahead.


Let me know what you think.  Do you have an emergency fund?  Do you think I’m crazy not to have one?

*I used the same methodology for this table that I did for my post “Will you lose money with stocks?”
How to invest a windfall

This is a first-world problem for sure, but many of us at one point or another will get large amount of money all at once.  We know from asset allocation that we should invest it in stocks, but the questions becomes one of timing.  Maybe it’s an insurance payout, a tax refund in April, a bonus check, or a bunch of cash you’ve accumulated in your checking account.  In fact, when I was still working at Medtronic every July the Fox family would face this exact scenario when I get my bonus check.  Let me tell you my thoughts on the matter (which of course is not an expert opinion, and which looks at historical price movements but makes no prediction on future stock movements).

When I would get my bonus, and what I would have suggested, is to take the big chunk of money and invest it in equal pieces over a couple months.  Vanguard and most places will let you set up an automatic investment, so in the words of Ron Popeil “you can set it and forget it.”  So let’s imagine someone would invest equal amounts each week for the next 10 weeks.   Why do I do it this way?  Because I’m a spaz.

If I invested all the money at once, I would be totally freaked out that I would buy at the wrong time—either I would buy the day after stocks went up 1% or I would buy the day before stocks dropped 1%.  Using simple scenario of $10,000 to invest, that would mean I could “lose” $100 by investing at the wrong time.  That would totally tie me up in knots and I would be looking at the stock market trying to find the exact right time to jump in, like a kid on the playground playing jump-rope.  Of course we know from A Random Walk Down Wall Street, that all that stuff is random so there’s no point trying to time it, but I’m not totally rational when dealing with that much money.

For the blog, I did a little analysis and found that 12% of the time stocks* lose at least 1% in a single day; if I bought the day before that happened, I’m out at least $100.  On the other side, about 13% of the time stocks rise 1% or more in a day; if I bought the day after that I’d similarly be out $100.

My fragile nerves just can’t take that so I want to “diversify” the timing of my purchases to even out those big ups and big downs.  This is a strategy called “dollar cost averaging”.  So as I said, initially I would have recommended is to take the cautious path, take $10,000 and split it into $1,000 chunks, and invest those each week for the next 10 weeks.


windfall analysis 2

But then using the magic of spreadsheets and the internet, I decided to see what the actual data said.  I looked at every week for the market since 1950 and did a comparison of the two scenarios:

  1. Invest your entire chunk of money all at once
  2. Spread your investment evenly over 10 weeks (dollar cost averaging)

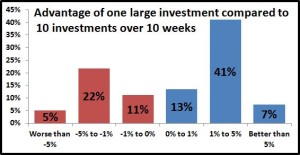
Wouldn’t you know that on average it’s better to invest your entire chunk at once?  I’ve been doing it wrong this whole time, so thank you Stocky Fox.  In fact it’s not even close—historically it has been better to do option #1 about 61% of the time.

The thinking is that historically, stocks have always gone up.  Sure there have been some rough patches, some of which can last a really long time, but the general trend is definitely upwards.  So if you wait to invest your money over a longer time period, you’re missing out on some of that upward trend.  I looked at every week since 1950 (if you were curious, there are about 3400 weeks) and on average you gain about 0.7% by going with option #1 instead of option #2.  0.7%!!!  Holy cow.  Remember that post on The power of a single percentage?  We just found a 1% coupon right there.

So my advice is to pick a day this week and invest it all in one fell swoop.  You might get hit with bad luck, but the odds are better that you’ll get hit with good luck to the tune of about 0.7% (which in your case is about $700).  On the day you do it, don’t even look at the stock market and have several tablets of Alka Seltzer on hand.

*For this analysis I am using the S&P 500 data going back to 1950.

Investing let me get my new car for free

A few years back our old Honda Civic went to heaven.  It had a terminal case of transmissionitis.

We bought a new Honda Fit which cost about $17,000.  However, when it was all said and done we got it for free.  This isn’t some scam or a crazy thing where we had to drive around with the sides painted as a billboard or anything like that.  This is how it worked:

In September of 2011 we bought our new car.  Our Civic had been struggling for a while so we had been saving money knowing that sooner or later we would need a new car.  Because of that we had the $17,000 in cash ready to purchase the car outright.

However, Honda offered a fairly generous financing program at 0.9% interest.  That’s a super low rate so it was very tempting.  There’s always the nagging idea that you shouldn’t borrow money if you don’t have to, but as low as it was we figured we had to consider it.

It was bit more complex, but for the sake of simplicity, let’s assume we had these two choices:

  1. Pay for the car in cash.
  2. Finance the car at 0.9% for 6 years and then invest the cash.

As you can guess from the tone of this post, we went with option 2.  Our plan was to finance the car, and then invest that $17,000 in a stock mutual fund (VTSMX).  Every month when a payment was due we could sell a few shares of the mutual fund.  At the end of 6 years we would either end up ahead, making this a really smart move, or behind making this a really dumb move.


Looking at the numbers

A 6-year loan for $17,000 at 0.9% interest requires a monthly payment of $243.  Back in September of 2011 the S&P 500 was at 1,131 (today it’s at 2,471).

Over the course of those 6 years, the market mostly went up, but it certainly had some rough moments.  2012 and 2013 were really good years for the stock market so I felt like I was a bit of a genius for doing this.  Then in 2015 stocks fell plus there were a few of those really crazy months like January 2016, when the market was in total freefall, and I felt like I was an idiot.  Stocks recovered in 2016 and then really took off after Trump’s election.

Needless to say, there were a lot of ups and down.  The smart thing would have been to just ignore the daily/weekly/monthly variations in the stock market and not get stressed, but that’s not in my character.  I did look at it every day, and I did get totally stressed out.

Foxy Lady and I stayed the course, and this month we sent our last check in to Honda.  Now we own that $17,000 car outright, the same way we would have had we paid cash for it 6 years ago.  However, the account we were using for all this still has about $16,400 of mutual funds in it.

That’s awesome.  We bought a $17,000 car, but we ended up with a car and $16,400!!!  In a way the car was very nearly free.  We started this process with $17,000 and no car.  We ended this process with $16,400 and a car.


Were we lucky or good?

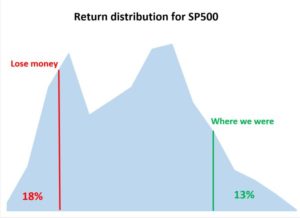
Our story had a happy ending, which begs the question how likely does it turn out this way.  The six years from Sep-11 to Aug-17 were a good run for stocks but by no means the best.  Going back to 1950 when the S&P 500 started, you can see how things stack up.

There are a couple important points.  First, success isn’t guaranteed here.  You would lose money (have to pay more than your original $17,000) about 18% of the time.  We know that over the long-term stock almost always do well.  This is a bit trickier because when you start this, you invest all your money at one time, so you don’t benefit from dollar cost averaging.  Had you invested right before a huge market downturn (think late 1960s to early 1970s or Mar 2001 or Aug 2008) that would really be awful timing.  Still, you come out on top 82% of the time, so those are pretty good odds.

Second, our timing was pretty good, but certainly not the best.  We would have done better 13% of the time.  The absolute best timing would have been if we did this scenario starting in September 1994 and ending August 2000.  Basically, that timed the investment just before the internet boom of the 1990s kicked off, averaging about a 24% each year.  If you’re curious, with that timing you would have ended up with a car plus about $25,000.

We can’t be lucky all the time but you don’t really need to be either.  You can look at a more average performance, let’s say starting in September 2002 and ending in August 2008.  You would have ended up with a car and $8,000, so basically you got a new car at a 50% discount.


Take free stuff

The other really important piece to this is the really low interest rate we were charged.  0.9% is not a normal interest rate.  As we discussed here about debt, sometimes it’s a good thing to take on debt.  Honda gives their car buyers an artificially low interest rate as an inducement to try to increase sales.  It could just as easily be cash back or lowering the cost of the car.  As it is they decided to give a really low interest rate.

Some car buyers would need to finance their purchase no matter what, so that 0.9% was just a bluebird.  Others, like us, had the choice: do we pay in cash or finance.  Had we paid in cash, we would have basically been leaving this sweet perk from Honda on the table.

We can pretty easily see the impact of using a more normal interest rate on our experience.  At 0.9% we ended up with the car and $16,400.  However, if we use 5%, then we still come out ahead, but not as much.  Instead of $16,400 we ended with $13,000.  Actually, I was a bit surprised that the impact wasn’t greater, but that’s why you have spreadsheets, right?

When all is said and done, hopefully this illustrates the point that being smart with investing, and really understanding what is likely to happen based on history, can really be lucrative.  Obviously this will apply to things like your 401k and IRA, but it also applies in more unexpected places like buying a car.

The Trump stock bubble

The normally very calm and thoughtful T. Lee (a good friend from my Medtronic days) expressed some strong anti-Trump feelings in a comment a couple days ago.  That puts him in good company with a large portion of the country.  But then he asked the following question:

“At what point, if there is one, should we consider pulling our money out of stocks and investments and holding cash, based on the disorder, confusion, and unbelievable uncertainty this tiny man of a president is causing domestically and abroad? Are there any telltale signals? I also ask because the housing market and stock market are at historic highs, and seem due for a pullback. I know it’s impossible to time the market this way, but just wondering perhaps there is an exception under extraordinary times.”

Let’s dig into this and see what we come up with.


Things aren’t that bad

Times are insanely partisan right now.  If you don’t like Trump it’s easy to think we are on the brink of oblivion, but things aren’t really that bad.  Let’s look at some times when things were REALLY bad and how stocks did (some of this is from a post I did a couple years ago so you can check that out here).

Let’s think of the worse times in the past 100 years.  A short list probably includes the start of WWII, the atomic bomb dropped, and the assassination of MLK.  In each of those things look bad, really bad, and maybe we would have thought that things were about to fall apart:

When Hitler invaded Poland and started World War II (Sep 1939)

When the US dropped two atomic bombs on Japan and started the nuclear era (August 1945)

When Martin Luther King was assassinated setting of some of the worst race relations since the Civil War (April 1968)

The civil unrest that’s going on in the US right now is a drop in the bucket compared those examples.  Even so, when things looked darkest, being an investor turned out to be a good thing.  That table looks at if you invested $1,000 per month starting at that bad event in the Dow Jones index, and how you would have ended up over different time periods.   Over a 20- or 30-year time horizon we know that we almost always come out ahead.  That definitely held true even in these examples.

I don’t think we have anything to worry about as investors because of Trump or all the current drama.  It’s important to keep things in perspective.


Pullbacks do happen

Definitely there will be a point when stocks will pull back.  That’s just the nature of the stock market.  Given that Trump has taken so much credit for the rise in the stock market, it will be interesting to see how he tries to avoid blame when it has a bad few months or a bad year.  Of course, he has shown his ability to grab credit and shed blame as well as any politician, so I’m sure he’ll come up with something.

In my post where I proved I was smarter than a Nobel Prize winner, I based that on the fact that two years ago Robert Schiller predicted stocks would not do well.  I disagreed and was much more optimistic.  Since then stock have been on a major tear, so there you go.

But it can’t last forever.  Here are the stock returns for each of the last nine years since the Great Recession: 28%, 17%, 8%, 9%, 29%, 9%, 0%, 13%, and 12% so far this year.  That’s a dream, and eventually we’ll take a pause from that incredible pace, but of course we don’t know when that will happen.  Robert Schiller, one of the very smartest people in the world, predicted it a couple years ago.  Maybe it will be this year (I did suggest maybe we’re seeing some early signs), or maybe it will be two years from now.  If it’s two years from now, there could very well be another 10% or 20% upside that you don’t want to miss.  As always I recommend holding tight and doing the long-and-steady investment strategy.


Bubbles

Despite the craziness going on in the White House right now, things actually seem fairly strong in the economy which makes me think a huge bubble burst unlikely.  If you look back over the past major financial bubbles in the US three come to mind—the Great Depression (1929), the Dot com bust (2001), and the Great Recession (2008)—the issues that caused those don’t seem to be in place.

Of course, it’s impossible to predict what will cause a bubble but if we look at those in turn I think we’ll see that things look okay.

Great Depression—That was the big one that was caused by a perfect storm of bad stuff.  You had an insane asset bubble that captivated the nation and was held up by fraudulent companies.  It was so bad that most of the SEC laws came about afterwards.  What is going on now isn’t anywhere close to that.

Dot com bust—Again we had an asset bubble where stocks that had no profits, and no prospect of getting profits any time soon were being valued through the roof.  Maybe there’s a bit of that now, but it seems fairly tame compared to back then.  Now companies like Amazon and Apple dominate the news, but those are very profitable companies.

Great Recession—This actually had little to do with the stock markets but more to do with the big bets banks were making backed up by small amounts of equity.  Things went bad for a bit, but then rebounded quickly.

That’s a quick rundown, and there’s a lot of detail we could go into for each of those, but none of those telltale signs seems to be with us now.  Banks are stronger than they were, there doesn’t seem to be widespread fraud, and the stocks driving the market are profitable.  But bubbles by their nature are hard to predict, so who knows.

That said, I will give you the steady advice that I always do which is to sit tight, do dollar cost averaging, and in the end you will very likely come out ahead.

Democrats are the best party for the stock market except . . .

. . . when Republicans are


“Politics suck” –everyone on Facebook

Given the incredibly bitter political partisanship affecting the country right now, it only seemed right to throw fuel on the fire by asking an incredibly incendiary question like: which political party is better for the stock market?

The stock market is a tricky mistress to the political parties.  Republicans seem to openly court this mistress with their pro-business and more capitalist policies.  When the stock market does well that is seen as a success.  Ronald Reagan’s trickle-down economics would have the stock market winners, who tend to be clustered among the wealthy, spend more and benefit everyone.

Most recently, Donald Trump has hailed the tremendous bull market during his presidency as a sign that his policies are working.  In case you’re curious, the S&P 500 is up over 15% since he was elected.   That’s pretty good, but certainly not the best.  Since 1950, of the 10 presidents who became president after being elected (I’m not counting Johnson or Ford), Trump ranks 3rd highest, behind John Kennedy (23%) and George HW Bush (25%) over similar time periods.

It’s a bit more complicated with Democrats with their more progressive agendas and socialist policies.  But make no mistake, Democrats want stocks to do well too.  Good stock markets are correlated with low unemployment.  When the stock market does well tax receipts are up.  One of the core bastions of Democrat ideology, the pension fund for public employees is nearly totally dependent on a strong stock market.

Whatever, that’s all politics.  You can agree or disagree with my thinking, but I don’t think there’s any doubt that both parties want the stock market to do well.


Republicans or Democrats?

So that leads to the big question: which political party does better with the stock market?

Here’s a table with a lot of data.  It shows the average return as well as the number of years since November 1950* for each scenario:

  Congress      
President

Republican

Democrat

Split

TOTAL

Republican

12%

(7 years)

3%

(22 years)

4%

(8 years)

5%

(37 years)

Democrat

16%

(8 years)

10%

(18 years)

15%

(4 years)

12%

(30 years)

TOTAL

14%

(15 years)

6%

(40 years)

8%

(12 years)

8%

(67 years)


There have been 37 years of Republican presidents and 30 years of Democrat presidents.  The average return for Republican presidents is 5%, for Democrats 12%.  Clearly DEMOCRATS are better, but wait . . .

Republicans have controlled both chambers of Congress 15 years, Democrats 40 years, and it has been split 12 years.  The average return for Republican Congresses is 14%, Democrat Congresses 6%, and split Congresses 8%.  Clearly REPUBLICANS are better, but wait . . .

Republican presidents have had a Republican Congress for 7 years where the average return was 12%.  Democrat presidents have had a Democrat congress for 18 years with an average return of 10%.  Clearly REPUBLICANS are better, barely, but wait . . .

Republican presidents have served with Democratic Congresses for 22 years with an average return of 3%.  Democrat presidents have served with Republican Congresses 8 years with an average return of 16%.  Clearly . . . wait there’s nothing clear about this one.  Who should get the blame for those below average Republican president/Democrat Congress years?  Who should get the credit for those really, really good Democrat president/Republican Congress years (that was mostly during Clinton’s administration)?

There’s a lot of ambiguity here, and I don’t think there’s a clear answer.  We could argue about it on Facebook, but that’s about as fun as a root canal.  No thanks.


There must be something in the water

Since 1950 the US stock market has done really well, amazingly well.  In November 1950, the S&P 500 was at 19.51; today it’s at 2480.91.  Let that sink in for a minute.

All that data I showed you was valuable to see in that it confirmed we are on a bit of a fool’s errand.  Asking if Republicans or Democrats make the stock market do better is the wrong question.  The important observation is that the stock market does well no matter who is running things.  If you’re an optimist that means either party is filled with good stewards who keep things going in a positive direction.  If you’re a pessimist that means the the American economy is so strong and robust that the idiots in Washington, on either side of the aisle, can’t screw things up.  Either way, that is a tremendously powerful and important and comforting insight.

The day after Trump was elected, the stock market had a really good day, rising 1.1% (Reagan’s day-after-election rise was 1.8%).  That was based on expectations of tax reform, reduced regulation, and healthcare reform, to name a few.  So far, pretty much none of that has come to pass, yet stocks are up 15%.

How different would that have been if Hillary Clinton was elected?  Maybe she doesn’t sign some of those executive orders on the Keystone pipeline.  Maybe she doesn’t rollback some of the regulations Trump has, maybe she adds some he hasn’t.  All maybes.  But those are all drops in the bucket compared to the gargantuan size of the US economy and the stock market which reflects it.

My absolute belief is that a strong US stock market reflects a strong US economy and business environment.  Awesomely, that goes beyond the power of one person in an oval office or 535 people down the road a bit.  We will win no matter who is there, and that makes things a lot easier.

So my answer is: Republicans are better for stocks but Democrats are better for markets.  Wait, maybe Democrats are better for stocks and Republicans are better for markets.  I forget now.  Damnit.


*All analysis in this post is based on the S&P 500 since the midterm election in November 1950.

January 2016—putting it in perspective

Cartoon-Leopard

You may recall a couple weeks ago that my mother-in-law, Mimi Ocelot, wrote an email expressing concern that the stock market was going to hell.  It was pretty understandable.  Two weeks into the new year and stocks had fallen 9%.  Wow!!!

Now that the month is over, let’s take a look at things and try to put them all in perspective.  How bad was January 2016 for investors?


Remembering the first two weeks of January

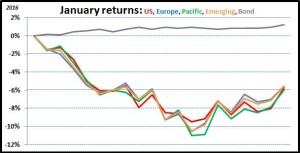
First, let’s just quickly recall how the month started.  After two weeks it was down 9% and then by Tuesday of the third week, it dropped even more, bottoming out at 11% below where things started for the year.  As you may remember, we looked at how bad that those first two weeks were from a historic perspective.

Since 1950, there had been 19 other two-week periods that were as bad as the first two weeks of January.  One way to look at it is there have been 1716 two-week periods since 1950 (66 years times 26 two-week periods per year).  So if 19 of those 1716 two-week periods were worse, that means things were worst about 1.1% of the time.  Any time something is in the 99th percentile of badness, that’s a big deal.

It was a tough couple weeks with everyone on TV has having a hissy fit about how the stock market was just terrible and all sorts of other crap.  And then this happened . . .


How the month ended

Capture

As I said, the third week started tough, dropping another 2%, but then things started to turn around.  By the end of the third week the market had gained 4% off its lows, finishing only down 7% for the month.  In the fourth and final week of the month, stocks had another good week, increasing about 1.5%.  So after all the carnage, stocks finished down about 5.5% for the month.

A month that is down 5.5% is obviously not a good one, but how bad is it really?  If you look at that same data from 1950, there are 792 months.  How many of those 792 months do you think were worse than January 2016?  If you guessed 66, you’re a winner!!!  66 seems like a lot actually.  That’s about 8% of the time.

Hmmmm.  66 months have been worse than this January.  66 times over 66 years.  That means that on average we have a month this bad once a year.  The last time we have a worse month was August 2015, and before that was May 2012, and then both August 2011 and September 2011.  How many of you remember any of those months as being really bad months for investing?  I’m guessing no one, and that’s the point, right?  During the time, it was probably bad, but then we moved on and the stock market continued its relentless upward trend.

Of course things are never steady and predictable with the stock market.  From 1990 to 1997 we had an eight year streak without a month as bad as January 2016.  Other recent streaks were five years starting in 2003 and most recently a three-year streak starting in 2012.

Conversely, in the depths of the Great Recession, in a six-month period starting in late 2008 there were FIVE months that were all worse than the one we just had.  Five out of six is bad.  OUCH.  And you know how that ended—everyone freaked out but those who kept their cool saw their investments completely recover and then some.


The point of all this is that the stock market has wild swings, and I have argued that the swings have gotten wilder in recent years.  At any given moment things may look crazy, but time has a way of evening this stuff out.  After two weeks it looked awful for the stock market.  We had a 99th percentile train wreck on our hands.  Two short weeks after that, things went from 99th percentile bad to 92nd percentile bad.  That’s a pretty big difference, a big improvement.

So as we wrap up January, no point sugar coating it, the month sucked for investors.  But also let’s not press the panic button either; months like this happen pretty frequently.  I hope that helps you sleep better at night.

What’s causing the volatility? Part 2

Welcome back.  Yesterday I started listing off reasons we’re seeing so much more volatility in the stock market. In this blog I’ll take you home.


 “Skynet becomes self-aware at 2:14 a.m. Eastern time, August 29th.” –Terminator 2 (1991)

Terminator 2 - 5

Computer-initiated trading drives a major, and increasingly larger, portion of the volume in stock markets.  It’s a good thing for a few reasons.  It gives people more options in their trading strategies, it offers precision that humans can’t match, it doesn’t get tired or forget or anything like that.  But it also leads to a lot of volatility.

One of the major types of automated trading is “stop-loss” trades.  This is when someone owns a stock like Nike and says something like: “I only want to sell it if it starts to fall.  Right now the stock is at $50, so sell it if it goes below $45.”  Emotionally it makes sense.  Everyone knows crazy things can happen with stocks and it can all go to hell in the blink of an eye (see: Enron or Worldcom or Blackberry).  So as the name implies, this stops your losses at some level you establish.  Awesome.  You have more control.

The reason this increases volatility is that this type of trade tends to compound the problem.  When stocks are going down these stop losses trigger which sells more stock which drives the prices down further which triggers more sell orders and so on and so on in a downward spiral.  The obvious flaw is that the computers which are doing this don’t have any idea of the intrinsic value of the stock they are selling; they just know they are supposed to sell when the stocks hit a certain level so that’s what they do.

When rational humans look at these types of situation (maybe like Boeing on July 12) and can “see” that the market is overreacting, things tend to go back to levels that make sense.  Probably the best example of this is the Flash Crash of 2010.  On May 6 of that year, probably the craziest 30 minutes ever of stock trading occurred.  In a matter of minutes the market fell about 10% (equivalent to about 1700 points on the Dow Jones Industrial Average if this happened today!!!), and then just as quickly recovered nearly all the loss.

What made it so crazy was that no news drove it.  Maybe news of a nuclear war starting or a meteor on a collision course for earth would justify such a rapid move.  Of course there wasn’t that, but there wasn’t anything—no news from the Federal Reserve, no companies going bankrupt or countries defaulting on their debt, or a regional skirmish, or a refinery blowing up, nothing.

In the aftermath, the leading theories all ultimately pointed to automated trading.  Some sell order lowered prices slightly but just enough to started triggering stop-loss orders.  That started a selling frenzy that drove prices down, leading to more stop-loss orders and in an instant everything went to hell.  Once thinking people saw this and knew that something weird was going on, they started buying those shares which were selling at 10% or 20% or even 50% less than they were 20 minutes before and made things normal again.  Like so many examples here, we ended where we started, but we had a crazy ride in the meantime.  More volatility.


“We keep inventing better ways to kill ourselves”

The stock market is an evolving landscape.  There was a time long, long ago when it was just stocks.  Then derivatives like options and futures came along as well as buying on margin (borrowing money to buy your stock); and now we have stuff like credit-default swaps (I can’t say I fully understand those), virtual currencies, and other really exotic things.  Like a gun or a power saw or a car, these financial tools can be very useful when used correctly but they can be disastrous when used recklessly.

Generally speaking these investments lead to higher volatility because they tend to be very leveraged.  You can make really, really large investments without a lot of money.  To buy 1000 share of Medtronic would cost you about $75,000; but to “buy” that same amount using call options would cost maybe something like $2000.  Of course, derivatives like stock options are much more volatile, and can lose all their value really quickly.

All the sudden that means you can be a small-time investor who decides to throw a Hail Mary in the stock market.  Instead of needing a bunch of money to take a major position, you could do it with much less.  Realistically, I as an individual probably couldn’t take such a big position to impact the market, but certainly a small bank could.  There are dozens of stories where some trader at a bank took a crazy big position, often times using derivatives, that went bad.  Not only does it take the bank down, but when that bank falls, just like dominos, others fall with it.  Same story: increased volatility.


So we’ve covered a lot of ground and come up with a lot of things that make today’s stock market much more volatile than it’s ever been in the past.  But let’s remember that the stock market is ultimately about fundamentals.  How strong are the companies?  Are they coming up with new products?  Are they finding better, faster, cheaper ways to meet our needs?  Those are the things that make the stock market go up over time.  And I believe all those things are there in today’s stock market.

In fact, of all the reasons I cited for increased volatility, I think all of them are good for the long-term value of the stock market.  Information traveling faster is a good thing; a globalized economy is a good thing; computer assisted trading is a good thing; financial derivatives are a good thing.  They’re all good and they all are making stocks continue to be a good investment.  Remember, stocks have been on a relentless climb for over a century.  In 2015, despite all the craziness, we were still hitting new all-time highs.

Sure, sometimes people screw things up, and because of this new age, those mistakes make a big impact.  But that big impact fades, usually very quickly.  So Mimi, as always, I think the stock market has great prospects for the long-term future, and I’m putting my money where my muzzle is on this one.  Your daughter-vixen’s retirement money as well as your grandcubs’ college funds are fully invested.

What’s causing the volatility? Part 1

0906_market-volatility_270x190

On Tuesday I responded to an email from a worried Mimi Ocelot about the free-fall the stock market is going through right now.  I provided a historical perspective of what is going on.  In this post I am going to give some reasons I think we’re experiencing all this increased volatility.

And I need to apologize.  I started writing this and it got so long (I try to keep my posts at about 1000 words) that I need to split this into a part 2 and a part 3.  So enjoy this and then tune in tomorrow for the exciting conclusion.


“The times they are a changin’”—Bob Dylan

As I wrote here, the volatility in the market is definitely going up.    Of those 17 two-week periods as bad as this one since 1950 that I mentioned on Tuesday, eight occurred in the fifty years from 1950 to 2000 which means that nine occurred in the fifteen years from 2000 to 2016.  There’s no question that the market has become MUCH more volatile lately.  Is this a temporary thing or a new normal?  Who knows, but I tend to lean towards “new normal”.  Now let’s try to figure out the “why” part of this mystery.


“Ready, Fire, Aim” –Tom Peters (1982)

Nearly everyone agrees that information is the lifeblood of the stock market.  Today, that information travels so much faster than in the past.  Something could happen in the most remote corner of the world, and you would know about it in everywhere in a matter of seconds or minutes.  Obviously quicker access to news is a good thing for society at large, and investing in particular, but it definitely exposes many investors to making big mistakes because they are acting so quickly.

marquee-787

A good example is July 12, 2013.  On that day a Boeing 787 caught on fire a Heathrow Airport in London.  Here’s some quick historic context: the 787 was Boeing’s next generation aircraft that was going to revolutionize air travel, a plane Boeing pretty much staked its entire future on.  In early 2013 two 787s caught fire, leading to the FAA and its counterparts around the world to ground all 787s until Boeing figured out the problem.  Boeing’s stock, as you would expect, got hammered.  It took Boeing several months, but they fixed the problems, got the 787s in the air again, and their stock recovered.

Then July 12 happened.  News broke that another 787 caught on fire.  Investors, understandably, concluded that the problems weren’t fixed after all and that the planes would be grounded again.  In a matter of minutes the stock cratered, falling from about $108 per share to $99.  Over the following hours and days, it became clear the July 12 fire had nothing to do with the previous problems; it was just one of those things that do happen every once in a while.  No big deal.  Two weeks later, Boeing’s stock was back to the pre-July 12 fire levels.  It was all like nothing happened; except it did happen and there was crazy volatility in the stock.

The morale of the story is that investors got the information so quickly and rushed to act on it so quickly, that they completely misevaluated the situation, and that led to a lot of volatility.  Had the news traveled more slowly, the world would have had more time for more of the facts to come out.  No matter how you slice it, the light-speed fast news makes the pace of investing faster, and when you do something faster, you tend to make more mistakes.


 “The chief business of the American people is business” –Calvin Coolidge (1925)

UNITED STATES - AUGUST 03: Official Portrait Of Calvin Coolidge On August 3, 1923, Then Vice President Who Succeeded Harding As President. He Was Elected In 1925. (Photo by Keystone-France/Gamma-Keystone via Getty Images)

We Americans are probably a bit spoiled.  There have been no wars fought on our soil since 1865 (I didn’t count Pearl Harbor, which reasonable people can debate).  There has been a consistent government since 1787 (or 1865 depending on how you think about the Civil War) without any coups or revolutions.  There’s never been a military takeover of the government, and the US government has never defaulted on its debt.  You could go on and on.

The reason that is important is that today about one third of all earnings in the S&P 500 come from outside the US.  It’s hard to find out what that number was in 1950 or 1960, but suffice it to say that that number was much, MUCH lower back then.  So we have a lot more international exposure now than in the past.

That’s a good thing because of diversification.  But it does expose us as investors to some of the geopolitical challenges that I just mentioned, that the US has been blessed to have avoided.

Also, to President Coolidge’s quote, the US tends to be oriented towards business (and some, but not I, would argue too oriented towards business).  This has definitely helped us become the largest and strongest economy in the world.  But other countries have other orientations (I’ll try not to use too blatant of stereotypes to offend my international readers): the Middle East is very theocratic, Japan focuses on saving face (keeping it from writing off bad debts which has stalled its economy for two decades), China is very authoritarian, Europe is more socialistic.  That doesn’t mean any of those other perspectives is bad.  But it does mean they are less likely to drive greater business and productivity, and those are not good if your goal is to have your stocks grow.

If you’re exposed to those geopolitical landmines as well as those competing priorities, it shouldn’t be surprising that the road won’t be as smooth.  And that’s just French for saying more volatility.


“The world is getting smaller” –Mark Dinning (title of a song from 1960)

Somewhat related to the above issue, the world is getting smaller (don’t think the irony is lost on me that a phrase we use to describe how fast the modern world is changing came from a song two decades before I was born).  Everything is so much more connected now, whether it be products (your car is connected to the internet which depends on satellites and under-water fiber optic cable) or countries (the components for your phone probably came from a dozen different countries).

All that interconnectivity is a good thing.  It means people/companies/nations can specialize in what they do best, allowing us to get the best products and services at the lowest prices.  But that connectivity also means that when the stone falls in the pond in one part of the world, the ripples hit everyone in some way, big or small.

Back in the day when the US economy was largely self-reliant, and even local economies were fairly independent, if crazy stuff happened across the world or even across the country, it didn’t affect things at home that much.  That impacts volatility because something is always going crazy somewhere.  And of course, that carries over to stocks which react to that craziness.  Gone are the days when General Mills was a regional foodstuffs provider for the Midwest; now its stock is affect by the Los Angeles longshoremen striking, the drought in sub-Sarahan Africa, and the revaluation of the Argentine peso.  Once again, more volatility.


This seems like a good stopping point.  We we’re almost done.  Come back tomorrow, same fox time, same fox blog, for the exciting conclusion to “What the hell is going on in the stock market?”

Two weeks into 2016 and already down 8%–OUCH

Dear Stocky,

Is anyone else besides me getting nervous about what’s happening in the stock market lately?  I always thought that the stock market did well in an election year but they’ve been going down.  I guess today things are a bit better.  But what do you think is going on?

I need to read some of your calming words again……

Mimi Ocelot


Here is an email that I got last Thursday.  The ironic thing is the market was up Thursday, but then crashed again on Friday, down about 2.5%.  So it’s understandable that Mimi Ocelot is nervous.


Also, for the sake of disclosure, Mimi is my mother-in-law, Foxy Lady’s mom.  Having known her for nearly 10 years, I can say she is definitely a nervous soul, but with the craziness going on in the market it’s understandable that even the heartiest of souls could be getting nervous.  Here is my take on the latest market gyrations.


“Just the facts” –Joe Friday, Dragnet


First, let’s look at the facts.  The thing about the stock market during election years is a bit of an old wives’ tale.  If you look back to 1950 (when the S&P 500 started), the returns during presidential election years averages about 7%, and the returns during other years averages about 9%.  So election years are a little worse, but they are both pretty good.  So this is another instance where people try to predict the market and they find they’re right about half the time and wrong about half the time.

Now let’s try to put these first two weeks of 2016 into perspective.  Stocks are down over 8% which is a pretty crazy steep fall over two weeks, but it’s not unprecedented.  Since 1950, there have been 17 two-week periods that had falls this bad or worse.  And of those 17 instances, 11 of them saw the stocks recover to their “pre-drop” levels a year later.  So that tells you most of the time you have these steep drops but the recovery is not that far off.

The other 6 times you ask?  One instance was during the 1987 market crash, and the other five were from the 2001 internet bubble or the 2008 financial crisis.  So maybe the recovery took a little longer, but not much.  After a couple years, stocks were hitting new highs.

So if you want encouraging words, I am definitely optimistic.  We’re going through a tough time, but nothing all that different from what happens every few of years.  Actually, the things that fundamentally affect the value of the stock market—a strong economy, innovation and scientific advancement, new products—all seem positive.  So I wouldn’t be worried.  Of course, Foxy Lady and I have a much longer time horizon that Mimi Ocelot so we can ride out a longer storm.  But things will be fine.

That said, there are some interesting market dynamics going on, especially lately.  I actually have a lot to say on this so I am going to break this up into a two-parter.  So tune in on Thursday to hear what I think is driving all this craziness.

Picking your investments for 2016

Decisions

The new year is a special time for me.  It’s a fresh start and a time of rebirth (even though it happens in the dead of winter).  You make resolutions, many of which you won’t keep, because this is the time to think about what you want to do before you get sucked into the rigmarole of actually doing it all.

For investing, it’s a natural time to reflect on your financial situation.  Am I saving enough to get where I want to go?  Am I investing that money in the places that make sense?  For this post I want to focus on the second question of where should you invest your money, and particularly should you change it from one year to the next.

Every year you have investments that do well and others that do poorly.  When you look on 2015 you’d see that international stocks (down about 4%) didn’t do nearly as well as US stocks (down about 0.2%).  Based on that what should you do?

One school of thought would be to invest more with US stocks.  If they did better last year, then it stands to reason that they’ll continue to do well since there probably hasn’t been a lot that has changed.  So stay with that winner.

The opposite school of thought is that the international stocks had a down year so they are probably “due” to do better.  Intellectually, I think this is the much more tempting strategy.  We know that stocks can’t continue incredible performance forever; eventually they will have an off year.  We also know that a well-diversified portfolio can’t continue to suck forever; eventually they will rebound (like stocks after 2008).


To answer this question with a little more analytic rigor I used my handy dandy computer and some free data from the internet.  Just to make things simple, let’s assume we live in a world with only two investments: US stocks (VTSMX) and international stocks (VGTSX).  As I mentioned, in 2015 US stocks did better than international.  So should we invest more in international?

Using data going back 19 years (that’s when the international index fund I am looking at started), the US fund has beaten the international fund 10 times.  That’s almost dead even—10 wins for US and 9 wins for international.

But the “wins” are very streaky.  US stocks performed better in 2015 as they did in 2014 and 2013.  On the other hand, International stocks outperformed US stocks for five years in a row starting in 2002.  Based on those snippets, you would have been worse off by switching your investments to last year’s underperformer.

If you look at all 19 years, there were 8 years when the lower performer from the previous year did better the next year.  Again, that’s about 50% of the time—8 years where the lower performer did better the next year, 10 years where the higher performer did better (it doesn’t add up to 19 because we don’t know which will do better in 2016).


Year

Investment that did better that year

Investment that did better the next year

2015

US

 
2014

US

US

2013

US

US

2012

Int

US

2011

US

Int

2010

US

US

2009

Int

US

2008

US

Int

2007

Int

US

2006

Int

Int

2005

Int

Int

2004

Int

Int

2003

Int

Int

2002

Int

Int

2001

US

Int

2000

US

US

1999

Int

US

1998

US

Int

1997

US

US


In a way the data is comforting, and it came out the way I predicted since I am a believer of efficient markets.  These theories on which stocks will do better tend to work about as often as it doesn’t.  Instead of spending a lot of time and effort trying to “figure out” which investment will do better, you’re probably best served just sitting tight.

The Fox family invests about equally between US and international stocks.  That means international stocks served us very well in the early 2000s but not so much the last couple years.  As far as next year goes, who knows?  I could tear the data apart and analyze it a million different ways, and I’d probably come out with something that said “doing it that way is better 50% of the time, and doing it the other way is better 50% of the time.”

So as the Fox’s take stock (pun intended) of our finances, we’ll continue plugging along with the same diversified investments we’ve used in the past.  Instead of trying to figure out which investment will do better this year, I’ll send that energy trying to figure out where Mini Fox hid the television remote.