North Korea not a problem, so says the market

A few days ago, a client called me a bit freaked out.  He wanted to sell out of stocks because of fears that the issue with North Korea could escalate into something terrible, possibly World War III.  Of course I told him to sit tight, because even in the darkest times stocks tend to do well over the long term.

Even so, what makes me so confident that the problems with North Korea won’t lead to a global catastrophe?  Simply put . . . THE MARKET TOLD ME SO.


The stakes are very high

Certainly, the stakes with North Korea are very high.  If things went bad, the outcomes could range from the Korean peninsula being destroyed to a nuclear war enveloping the globe.

If armed conflict broke out, almost assuredly North Korea would attack South Korea and particularly Seoul with a deadly barrage of artillery.  The human cost would be immense.  Also the damage to companies and their property would be vast.  That doesn’t seem important when compared to all the lives that would be lost, but more on that in a minute.

If the conflict spread, Japan would probably be the next victim of North Korea before the US and its allies took control.  Then the two absolute worst case scenarios would be a) North Korea realizing its nuclear-tipped ICBM dream and hitting the US mainland or b) China and Russia being drawn into a war against the US.  Those last two scenarios would lead to unparalleled loss of life and destruction of company property.


Destruction is bad for the stock market

Why do I keep saying “destruction of company property?”  That seems to pale in importance compared to the thousands or millions of lives that could be lost with the doomsday scenarios we’re talking about.

If war broke out a lot of company property, plant, and equipment would be destroyed.  Also a lot of company employees would be killed.  Potentially, if we went to a wartime economy like in World War II, companies would stop making cars and phones and shirts, and start making fighter jets, military gadgets, and uniforms.

All those things would be horrible for the companies’ profitability and therefore their stock price.  Here’s the punchline—if war broke out, that would be terrible for the world’s stock markets overall.  That terribleness would be most acute where the fighting was taking place.


The stock market is pretty smart

There has been a lot of academic study of the wisdom of groups over the individual.  I took a class with Nick Epley at the University of Chicago that looked into this, and that’s one of the lessons that has really stuck with me over the years.  The idea is that if you have a bunch of people with a bunch of different opinions, the “average” opinion is going to turn out to be more right than most of the individual opinions.

Where is the biggest, most organized collection of opinions? In the stock market.  It is fundamentally people with opinions (will things be good and stocks go up, or will things be bad and stocks go down?) betting against each other.  The result of all the bets results in the general movement of the stock market.  If more people bet good things will happen, stocks go up.  If more people bet bad things will happen, stocks go down.

Stock markets have a lot more credibility than talking heads because the former involves people putting their money where their mouth is.  It’s easy to say you are certain that something is going to happen; it’s another bet your money that something is going to happen.  That’s why the stock market tends to get it right, because greedy people who want to make more money are betting.

With regard to the Korean conflict, it’s easy for guests on news channels to say how bad that nuclear test is or how much closer that missile launch puts us to war.  But are those concerns credible?  Does the talking head or the new network really believe that, or is it just a flamboyant statement meant to capture viewer’s interest?


Divining the markets’ message

We’ve talked about geopolitics and stock markets and the destructive potential of a war with North Korea.  Let’s bring it all together.

If war breaks out, a lot of destruction will occur, and that will be horrible for the stock market.  That’s particularly true as you get closer to the epicenter—things will be worse for South Korean stocks since they’ll be the first victims of the war, probably followed by Japan, and then the rest of the world.

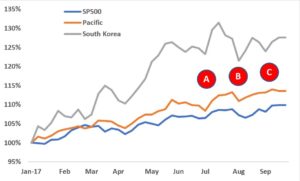
If things were REALLY bad, you should see that reflected in the stock markets, yet it isn’t.  If you compare the S&P 500 and a broad Pacific Index (Japan, South Korea, Australia, etc.) and a South Korean stock index, none show signs that a horrible event is going to happen.  In fact, of those three, the South Korean index has VASTLY outperformed the other two.  So much for a real concern that unparalleled destruction is imminent.

That’s not to say there haven’t been reactions.  In the beginning of July (point A) North Korea tested a long-range missile.  South Korean and Pacific markets reacted a little (about 1-2%) and US markets were unfazed.

Later in the month, North Korea tested a second missile that put Guam within range (point B).  Again, there was a reaction from the markets, this time larger and this time the US markets also reacted.

Finally, at the beginning of September, North Korea tested its largest nuclear device yet (point C).  Again, all three markets reacted.

So what does it all mean?  The market did react downward every time one of these tests occurred which means that more people (or more accurately more money) think there is something to be worried about.  However, the shallowness of the dips show that the bad things that “are likely to happen” really aren’t that bad and are more than offset by the good things going on with companies, profits, employment, etc.

Particularly interesting is the South Korean stock market.  If conflict did break out, they would be on the front line and they would suffer the most devastation.  Their reaction to North Korea’s developments are the largest which makes sense.  But like the rest of the world, the South Korean stock market quickly shrugs off the threat and moves on.  As I mentioned earlier, the South Korean stock market has done really well this year, which must mean that they don’t view the threat of war to be that likely.


I hope this gives you comfort; it does to me.  It’s not hard to get wrapped up in all this crap.  Trump and Kim Jong Un certainly don’t make things calmer, and those missile tests keep flying longer and longer distances.  When someone gets on CNN saying we are on the doorstep of Armageddon, it’s easy to believe it, but I think those people are full of crap.

The stock market has a powerful collective wisdom that has a really good track record of being right when individuals are dead wrong.  I think looking at how the stock market has reacted to all of this, and particularly how the South Korean stock market has, should give us all some comfort.

 

Is your house a good investment?

I’m trying to build my audience, so if you like this post, please share it on social media using the buttons right above.

For most Americans, their home is the largest purchase they will ever make in their lives, and it is their largest asset.  A lot of people call a person’s home their largest “investment”.  That begs the question: Is your home a good investment?


Definition of an investment

We need to remember what an investment is, particularly for this.  An investment is where you pay for something and then either get payments, like a dividend, or you are able to sell it at some point in the future for a profit.

For houses, you don’t really get a periodic payment.  That may be the case for rental properties which I’ve discussed here.  But for this post, let’s assume you use your home for your personal residence.  That means for the idea of an investment to work, you need to sell your home for more than you bought it.

Now that we have that out of the way, let’s figure this out.

Our story

A lot of times in personal finance, it’s better to be lucky that good.  Foxy Lady and I were very fortunate when we bought and sold our Los Angeles house.  It turned out to be an awesome investment (or so we have always thought, but let’s wait until the end of this post for a final verdict).

Shortly after we were married in 2010 we moved to LA.  That was pre-cubs but we knew we wanted to start a family, so we bought a cozy 3-bedroom house for the low, low price of $785,000.  What?!?!?  Los Angeles real estate is insane.

In 2015 I retired and we moved from LA to North Carolina.  As insane as housing prices were in 2010, they got even more insane in 2015.  We were able to sell our house for $1,150,000.

Wow!!!  That’s a heck of a profit.  Definitely that shows that in our case, our house was an awesome investment.  Not so fast.  Let’s look at the numbers and really figure out how good of an investment it was.

Our $785,000 investment grew $365,000, so that’s a 46% increase.  That seems like a really high return, but wait . . .

That was over 5 years, so on a compounded annual basis that’s about 8%.  Still, that’s a really good return, but wait . . .

We did a fair number of home improvements to our house.  When we bought the house there was a bit of water damage on one of the outside doors, so we replaced those plus a few of the windows.  Plus we decided to paint the outside because it has a hideous white color.  Also, we did a lot of landscaping work and had to fix the sprinklers.  Let’s say all that came to $20,000.

Later in 2014, Foxy Lady completely redid the kitchen and bathrooms.  It was one of her crowning achievements, and a bit of her died when we moved just a few months later.  That all cost about $40,000.  If you factor that in, then the return falls to 7%.  Most people will take 7% any day, but wait . . .

We were really lucky in that we sold our house as part of Foxy’s relocation package for her new company.  Normally, realtor fees are about 6% of the house’s selling price.  That would come to about $77,000.  Fortunately, we didn’t have to pay that, but under most circumstances we would have.  Had we factored that in the return falls to 5%, but wait . . .

Then there were other costs like property taxes (about $10,000 annually) and regular repairs like when we had to replace our dishwasher (let’s call that $3,000 each year).  If you factor that in, the return bottoms out at about 4%.  That is a far cry from the 46% we originally had in our head.

Maybe we’re being too pessimistic.  There’s some upside, right?  Sure there is.  It did act as shelter for us.  Let’s say it would have cost us $4,000 per month to rent a place like that.  In a way that acts like a bit of a dividend; owning that house gave us $4,000 of value each month.  That is a huge factor which has a major impact, raising our return from 4% to over 9%.

Plus, on the upside, selling your home has some nice tax advantages depending on the circumstances.  If you owned the house and used it as a personal residence for at least a couple years (to avoid flippers), then any profits on your house up to $500,000 ($250,000 if your single) are not taxed.  If you had profits for stocks those would be taxed like a capital gain whose rates are around 15-20%.  That is actually a pretty ENORMOUS advantage.  In our case, we had a profit of about $300,000 after you accounted for the home improvements we did; a 20% tax rate would have come to $60,000.  As it was, we didn’t pay any of that.

Looking to the data

We had our story, but I have this nagging feeling that we got fairly lucky with the house.  Imagine an investor whose only experience with stocks was buying in 2012.  They would have had a annual return of about 11%.  Hopefully they would have the perspective that that isn’t normal for most investors over most periods of time, and they just happened to have really lucky timing.

For housing it’s a bit tougher to figure that out.  In the stock market we have all sorts of data that bloggers (whose kids just went back to school, so they have more time on their hands) can parse a million ways.  Not the case with housing.

First, there’s just not that much data out there.  Second, the calculation becomes complex for all the reasons we discussed in our situation.  You have to control for things like home improvements, repairs, etc.

That said, my BFF Robert Schiller in all his smartness has the authoritative data on the subject.  Going back to 1950, the same year the S&P 500 started, housing prices have increased 0.4% annually.  That seems crazy low.  We know that houses are more expensive now than they were back then.  Did the Nobel Prize winner get it wrong?

No, he got it right.  That 0.4% is the increase if you hold everything else constant.  Since 1950 houses have gotten a lot bigger, made with better materials, with more features, and all that stuff.  Using some hard-core statistics, you can strip all that stuff out and find out how much the house on it’s own increased in value.  That number is 0.4% annually.

Just in case you were wondering, the S&P 500 has increased 11% annually since 1950.  BOOM!!!

During that same period of time that we owned the house, stocks were up over 12%.  Granted, that was during a decent market run, but that kind of makes it apples to apples comparing that to a really strong run for California real estate.  Just from a numbers perspective, it would have been better for us to rent and put all that money into the stock market than what we actually did.

Putting it all in perspective

9% seems like a huge return for our house (4% if you just count the house), given that I typically use 6-7% as my expected return for stocks.  That should be a vote in the “yes” column for the question: “Is your house a good investment?”

However, based on the data it seems like we had really, REALLY good timing.  If normally houses appreciate 0.4% when you strip out all the other stuff, then our experience where we got a 4% return seems like a major outlier.  Conversely, stocks had a return of 12% when they historically have a return of 11% or so.  We could debate which was MORE lucky, but I definitely think the appreciation of the house was a greater outlier.

What does it all mean?  Houses tend to appreciate about 0.4%, but if you include the value it provides as shelter while you hold it as an investment, maybe that bumps it up to 5% or so.  It also has favorable tax treatment so those are all really attractive.

However, stocks on average return about 8% per year.  So even with the tax benefit, ON AVERAGE (which is a crazy term in and of itself), houses aren’t that good of an investment compared to the stock market.  Even in our case, where we had an awesome run with our house, the stock market did better.

Does that mean that we should never buy a house, only renting and then using that money in the stock market?  No, I don’t think so.  There are really good reasons to buy a home beyond the investment angle.

In my opinion, the most important element is self-determination.  I weighed the pros and cons of home ownership here, and the one thing that transcends money is when you buy a home you control your future.  In that post I mentioned how our neighbors who were renting didn’t have their lease renewed and had to move.  Also, people who rent don’t tend to upgrade their house to make it as nice as they want.  Those are important considerations that, at least for us, tip the balance towards homeownership.  But what doesn’t make a very compelling argument is the fallacy that homes make great investments.

The Trump stock bubble

The normally very calm and thoughtful T. Lee (a good friend from my Medtronic days) expressed some strong anti-Trump feelings in a comment a couple days ago.  That puts him in good company with a large portion of the country.  But then he asked the following question:

“At what point, if there is one, should we consider pulling our money out of stocks and investments and holding cash, based on the disorder, confusion, and unbelievable uncertainty this tiny man of a president is causing domestically and abroad? Are there any telltale signals? I also ask because the housing market and stock market are at historic highs, and seem due for a pullback. I know it’s impossible to time the market this way, but just wondering perhaps there is an exception under extraordinary times.”

Let’s dig into this and see what we come up with.


Things aren’t that bad

Times are insanely partisan right now.  If you don’t like Trump it’s easy to think we are on the brink of oblivion, but things aren’t really that bad.  Let’s look at some times when things were REALLY bad and how stocks did (some of this is from a post I did a couple years ago so you can check that out here).

Let’s think of the worse times in the past 100 years.  A short list probably includes the start of WWII, the atomic bomb dropped, and the assassination of MLK.  In each of those things look bad, really bad, and maybe we would have thought that things were about to fall apart:

When Hitler invaded Poland and started World War II (Sep 1939)

When the US dropped two atomic bombs on Japan and started the nuclear era (August 1945)

When Martin Luther King was assassinated setting of some of the worst race relations since the Civil War (April 1968)

The civil unrest that’s going on in the US right now is a drop in the bucket compared those examples.  Even so, when things looked darkest, being an investor turned out to be a good thing.  That table looks at if you invested $1,000 per month starting at that bad event in the Dow Jones index, and how you would have ended up over different time periods.   Over a 20- or 30-year time horizon we know that we almost always come out ahead.  That definitely held true even in these examples.

I don’t think we have anything to worry about as investors because of Trump or all the current drama.  It’s important to keep things in perspective.


Pullbacks do happen

Definitely there will be a point when stocks will pull back.  That’s just the nature of the stock market.  Given that Trump has taken so much credit for the rise in the stock market, it will be interesting to see how he tries to avoid blame when it has a bad few months or a bad year.  Of course, he has shown his ability to grab credit and shed blame as well as any politician, so I’m sure he’ll come up with something.

In my post where I proved I was smarter than a Nobel Prize winner, I based that on the fact that two years ago Robert Schiller predicted stocks would not do well.  I disagreed and was much more optimistic.  Since then stock have been on a major tear, so there you go.

But it can’t last forever.  Here are the stock returns for each of the last nine years since the Great Recession: 28%, 17%, 8%, 9%, 29%, 9%, 0%, 13%, and 12% so far this year.  That’s a dream, and eventually we’ll take a pause from that incredible pace, but of course we don’t know when that will happen.  Robert Schiller, one of the very smartest people in the world, predicted it a couple years ago.  Maybe it will be this year (I did suggest maybe we’re seeing some early signs), or maybe it will be two years from now.  If it’s two years from now, there could very well be another 10% or 20% upside that you don’t want to miss.  As always I recommend holding tight and doing the long-and-steady investment strategy.


Bubbles

Despite the craziness going on in the White House right now, things actually seem fairly strong in the economy which makes me think a huge bubble burst unlikely.  If you look back over the past major financial bubbles in the US three come to mind—the Great Depression (1929), the Dot com bust (2001), and the Great Recession (2008)—the issues that caused those don’t seem to be in place.

Of course, it’s impossible to predict what will cause a bubble but if we look at those in turn I think we’ll see that things look okay.

Great Depression—That was the big one that was caused by a perfect storm of bad stuff.  You had an insane asset bubble that captivated the nation and was held up by fraudulent companies.  It was so bad that most of the SEC laws came about afterwards.  What is going on now isn’t anywhere close to that.

Dot com bust—Again we had an asset bubble where stocks that had no profits, and no prospect of getting profits any time soon were being valued through the roof.  Maybe there’s a bit of that now, but it seems fairly tame compared to back then.  Now companies like Amazon and Apple dominate the news, but those are very profitable companies.

Great Recession—This actually had little to do with the stock markets but more to do with the big bets banks were making backed up by small amounts of equity.  Things went bad for a bit, but then rebounded quickly.

That’s a quick rundown, and there’s a lot of detail we could go into for each of those, but none of those telltale signs seems to be with us now.  Banks are stronger than they were, there doesn’t seem to be widespread fraud, and the stocks driving the market are profitable.  But bubbles by their nature are hard to predict, so who knows.

That said, I will give you the steady advice that I always do which is to sit tight, do dollar cost averaging, and in the end you will very likely come out ahead.

Democrats are the best party for the stock market except . . .

. . . when Republicans are


“Politics suck” –everyone on Facebook

Given the incredibly bitter political partisanship affecting the country right now, it only seemed right to throw fuel on the fire by asking an incredibly incendiary question like: which political party is better for the stock market?

The stock market is a tricky mistress to the political parties.  Republicans seem to openly court this mistress with their pro-business and more capitalist policies.  When the stock market does well that is seen as a success.  Ronald Reagan’s trickle-down economics would have the stock market winners, who tend to be clustered among the wealthy, spend more and benefit everyone.

Most recently, Donald Trump has hailed the tremendous bull market during his presidency as a sign that his policies are working.  In case you’re curious, the S&P 500 is up over 15% since he was elected.   That’s pretty good, but certainly not the best.  Since 1950, of the 10 presidents who became president after being elected (I’m not counting Johnson or Ford), Trump ranks 3rd highest, behind John Kennedy (23%) and George HW Bush (25%) over similar time periods.

It’s a bit more complicated with Democrats with their more progressive agendas and socialist policies.  But make no mistake, Democrats want stocks to do well too.  Good stock markets are correlated with low unemployment.  When the stock market does well tax receipts are up.  One of the core bastions of Democrat ideology, the pension fund for public employees is nearly totally dependent on a strong stock market.

Whatever, that’s all politics.  You can agree or disagree with my thinking, but I don’t think there’s any doubt that both parties want the stock market to do well.


Republicans or Democrats?

So that leads to the big question: which political party does better with the stock market?

Here’s a table with a lot of data.  It shows the average return as well as the number of years since November 1950* for each scenario:

  Congress      
President

Republican

Democrat

Split

TOTAL

Republican

12%

(7 years)

3%

(22 years)

4%

(8 years)

5%

(37 years)

Democrat

16%

(8 years)

10%

(18 years)

15%

(4 years)

12%

(30 years)

TOTAL

14%

(15 years)

6%

(40 years)

8%

(12 years)

8%

(67 years)


There have been 37 years of Republican presidents and 30 years of Democrat presidents.  The average return for Republican presidents is 5%, for Democrats 12%.  Clearly DEMOCRATS are better, but wait . . .

Republicans have controlled both chambers of Congress 15 years, Democrats 40 years, and it has been split 12 years.  The average return for Republican Congresses is 14%, Democrat Congresses 6%, and split Congresses 8%.  Clearly REPUBLICANS are better, but wait . . .

Republican presidents have had a Republican Congress for 7 years where the average return was 12%.  Democrat presidents have had a Democrat congress for 18 years with an average return of 10%.  Clearly REPUBLICANS are better, barely, but wait . . .

Republican presidents have served with Democratic Congresses for 22 years with an average return of 3%.  Democrat presidents have served with Republican Congresses 8 years with an average return of 16%.  Clearly . . . wait there’s nothing clear about this one.  Who should get the blame for those below average Republican president/Democrat Congress years?  Who should get the credit for those really, really good Democrat president/Republican Congress years (that was mostly during Clinton’s administration)?

There’s a lot of ambiguity here, and I don’t think there’s a clear answer.  We could argue about it on Facebook, but that’s about as fun as a root canal.  No thanks.


There must be something in the water

Since 1950 the US stock market has done really well, amazingly well.  In November 1950, the S&P 500 was at 19.51; today it’s at 2480.91.  Let that sink in for a minute.

All that data I showed you was valuable to see in that it confirmed we are on a bit of a fool’s errand.  Asking if Republicans or Democrats make the stock market do better is the wrong question.  The important observation is that the stock market does well no matter who is running things.  If you’re an optimist that means either party is filled with good stewards who keep things going in a positive direction.  If you’re a pessimist that means the the American economy is so strong and robust that the idiots in Washington, on either side of the aisle, can’t screw things up.  Either way, that is a tremendously powerful and important and comforting insight.

The day after Trump was elected, the stock market had a really good day, rising 1.1% (Reagan’s day-after-election rise was 1.8%).  That was based on expectations of tax reform, reduced regulation, and healthcare reform, to name a few.  So far, pretty much none of that has come to pass, yet stocks are up 15%.

How different would that have been if Hillary Clinton was elected?  Maybe she doesn’t sign some of those executive orders on the Keystone pipeline.  Maybe she doesn’t rollback some of the regulations Trump has, maybe she adds some he hasn’t.  All maybes.  But those are all drops in the bucket compared to the gargantuan size of the US economy and the stock market which reflects it.

My absolute belief is that a strong US stock market reflects a strong US economy and business environment.  Awesomely, that goes beyond the power of one person in an oval office or 535 people down the road a bit.  We will win no matter who is there, and that makes things a lot easier.

So my answer is: Republicans are better for stocks but Democrats are better for markets.  Wait, maybe Democrats are better for stocks and Republicans are better for markets.  I forget now.  Damnit.


*All analysis in this post is based on the S&P 500 since the midterm election in November 1950.

I screwed myself by rolling over my 401k

rollover-ira

Kind of, but not really.  I wanted to put a dramatic headline up to see if that would drive more traffic.  However, I did lose a little bit of money by rolling over my 401k from Medtronic into my IRA with Vanguard.  Here’s my story:


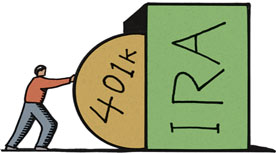
As you know, I left my job at Medtronic a while back.  Whenever you leave a job, there’s actually a lot of work involved with your finances.  You have to move them from the accounts set up by your company, to your own individual accounts.  Best case is it’s a pain in the butt; worst case is you can forget about some of it and lose it forever.  So it’s an important process.

So when I left Medtronic I knew I had to take my 401k account and roll it over into an IRA.  But there wasn’t a lot of urgency because Medtronic had their 401k at Vanguard, and all our other accounts are at Vanguard, so it seemed fine.  But then the Medtronic/Covidien merger happened, and as part of that, Medtronic switched from Vanguard to Aon Hewitt.  I wanted to keep all my money in one place for convenience sake, so I called Aon and initiated the rollover.

For those who have never done it, it’s a pretty simple process.  You set up an IRA account where you want the money to go (Vanguard in my case).  They’ll ask you how you want to fund the IRA and you click on a choice that says something like “Rollover”.  Then you call up the place where you’re money is at (Aon in this case) and start the process.  Usually they’ll send you a check which YOU DO NOT CASH, but instead just send it on to Vanguard.  Overall the process takes about two weeks.

But that two weeks is what screwed me a little bit.  During those two weeks your money is not in the market.  As you know from many posts I have done, the stock market is really unpredictable in the short-term, so it’s impossible to time the rollover process to your advantage.  Ideally, that two week process would coincide with a brief downturn in the market.  Conversely, you hope that two week period isn’t when the market stages a blazing recovery.

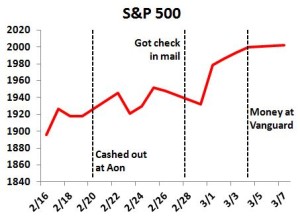
Based on the title of this post, you can probably guess what the case was for me.  As we know, the first few weeks of the year were really bad for stocks, and then they started a slow recovery.  If I could predict the future, that would have been the time to do my rollover, at the beginning of the year right before stocks fell 10% over the course of a couple weeks.  Of course, if I could predict the future, I would own my own island in the Caribbean.

I took the plunge in mid-February, and as you can see, stocks started inching up.  It was a perverse feeling: of course I like when stocks go up because we have so much invested in stocks.  But on the other hand, I felt that part of my portfolio was missing out on those gains.  Following the stock market too closely can really mess with your head.  Anyway, after a week, I got my check from Aon, which I promptly sent to Vanguard.  In that week, stocks were up about 0.8%.  My 401k from Aon was worth about $140,000, so missing out on that 0.8% gain cost me about $1100.

Once I put the check in the mail to Vanguard, the investing gods decided I needed to be further humbled, so in the next week stocks went on a major tear, rising about 3.2%.  Of all the times, why then?  My being out of the market for that week cost me another $4400.

Roll over IRA

Add that up and you’re talking a decent chunk of change.  My timing for doing the rollover couldn’t have been worse, and in the end I missed out on about $5500 in market gains.  That sucks.

But you win some and you lose some.  I am sure that I have come out ahead some of the other times I’ve transferred accounts, but as Matt Damon’s character said in Rounders: you tend to remember your spectacular loses more than your amazing wins.  Just human nature I guess.

That said, there’s definitely a lesson there, which is you need to stay in the market.  As we have discussed ad naseum, the market is very unpredictable in the short term often times with wild swings.  But over the long term it has a relentless upward march.  I had to get out of the market for a pretty unavoidable reason, so maybe I get a pass.  But what about those people who got spooked by the January plunge and then missed out on the February recovery?  They got crushed and could have really hurt their financial plan.


So there you go.  I hope you were entertained by my misfortune.

Why are falling oil prices dragging the market down?

oil-well-art-d0e8499fbec07478-1-

Oil is pretty special.  After air and water, it’s probably the most important substance for mankind.  Different from air and water, oil is not free (or nearly free).  Oil touches every part of our life, even the lives of “green” people who drive electric cars and have solar panels on their roofs.  Oil takes us from point A to point B in our cars and airplanes.  It gets every single product from its producer to its consumer—food, clothes, cars, phones, everything.  In many communities it powers the plants that literally keep our lights on.

Historically, going all the way back to its discovery in Pennsylvania in the 1859, the price of oil has been prone to booms and busts.  Early on, the discovery of a single well could send prices plummeting, driven by fears of over-supply.  More recently, supply restrictions like OPEC or geopolitical conflict can send the price soaring; while signs of weakness in demand like a global economic recession can send prices diving.

The past couple years have been no different.  Oil has fallen from over $100 per barrel to where it stands today, less than $35.  That’s quite a fall in prices, but why is that such a big deal?  Interestingly, as the market has been struggling the past few months, many market pundits cite the fall in oil is hurting the stock market.  But does that really make sense?  Let’s take a look.


Market pundits, as usual, are full of crap

As we all know, the market has been extremely volatile lately.  That coupled with the price of oil falling has led a lot of talking heads on channels like CNBC to correlate the fall in the market to the fall in oil.  However, if you look closely, you’ll see that there isn’t much of a correlation.

Since 2014, the price of oil has fallen 65 weeks and risen 47 weeks, while the S&P 500 has fallen 49 weeks and risen 63 weeks.  So there different but the real nail in the coffin is that of the 112 weeks, oil and the S&P 500 have moved in the same direction . . . (wait for it) 53% of the time.  So they have both risen or both fallen a little more than half the time.  They have gone in opposite directions, one goes up and the other goes down, 47% of the time.  That seems like a flip of the coin to me.  So the data totally refutes the idea that oil is driving the market in a major way.

The markets are incredibly complex, and it’s naïve to believe that the price of a single commodity, even the most important commodity there is, would drive the market.  Those talking heads need their sound bytes and need to appear as though they’re explaining what’s going on, but we know better.

So first, and foremost, don’t believe everything you hear from CNBC.  They have a lot of airtime to fill, and they say a lot of stuff that under the slight of Stocky’s analytic scrutiny is total crap.


Case for the fall in oil hurting the stock market

Obviously if the price of oil falls 70% over the course of a couple years that is going to have a devastating impact on the oil industry.  And remember that the oil industry is incredibly big (probably about the third largest industry in the US) and incredibly complex.  There are geologists looking for new oil deposits, drillers, truckers and pipeline people taking oil to/from refineries, refiners, all the way down to gas station attendants.  So let’s look at how the price of oil impacts them.

The people who run gas stations aren’t going to be affected at all.  Drivers are still filling up their cars (probably even more than before because gas is so cheap), and the gas stations are still making their couple cents markup on each gallon of gas.  No Impact.

Refiners are probably impacted a little bit, not because their business is going down (similar to the gas station people, it’s probably going up), but because their customers, the oil producers are getting squeezed by price, so that is probably trickling down to them.  My neighbor owns a couple oil refineries and he has mentioned that they normally charge something like 15% of the cost of the oil they refine, so obviously if prices go down they get impacted.  But people are still using plenty of oil so the refiners are still going to be plenty busy, and if they have to raise prices to make it work, basic economics say they should be able to.  Small impact.

Geologists and drillers in the US are feeling the pain.  When oil was at $100 there was a huge incentive to try to find extra supply so that kept a lot of these people employed looking for and then drilling new oil wells.  However, as you can easily imagine, when oil is trading at $30 there’s no where near that incentive to find new wells.  Plus you have all the industry that goes with helping set up wells and keeping them running.  Think of cranes and enormous drills, wiring and tubing; all sorts of crap (Halliburton is a big player here).  When you aren’t looking for new wells, you don’t need all that other stuff.  A lot of those people are out of work.  Major impact.

That even flows through (pun intended) to the people running the wells that are online.  Even after you factor in the huge start-up costs to find a well and get it going (more on that in a minute), there are significant costs in keeping a well up and running.  If a well is profitable at $100 but not at $30, then those wells might get shut down, and those people might lose their jobs.  Medium-major impact.

Finally you have the truckers who transport the oil around.  They are probably getting less business taking crude oil from US fields to the refineries, but they should have just as much business as ever from taking refined gasoline to the gas stations.  Plus, truckers are pretty flexible; if they aren’t driving oil they can easily drive something else.  Small-medium impact.

There are a lot of players in the oil industry, and some of them, especially those involved in the discovery of oil are really hurting.  And of course this has a compounding effect where they lose their job, can’t buy things other people product, and on with the downward spiral.  But let’s not lose sight of the bigger picture.  There are probably 150 million working Americans.  Only a very, very small fraction of those are in the energy industry, and only some of them are losing their jobs.  So this impacts a relatively small number of people, but it impacts them in a large way.


Case against the fall in oil hurting the stock market

How about the rest of us?  Oil’s price falling is unambiguously a good thing.  Something we all need is getting less expensive.  Obviously we feel that at the pump where it used to cost $60 to fill up our car and now it only costs $25.  We can all use that $35 to spend on other things which keep other people employed, or we could (gasp!!!) save it.

And as I said above, oil permeates through every part of the economy.  So if you don’t drive a gasoline car, you’re still getting the positive benefit because it cost less to get your food to the grocery store, to fly your FedEx package across the country, and nearly every other thing you use in your daily life.  This is what the press has called the “oil dividend,” the extra money that we’re all getting because things aren’t as expensive.  It won’t add up to millions, but it’s not unreasonable to imagine a family saving $1000 a year because of the lower oil prices.

If you compare two scenarios though, it seems lopsided.  An oil worker is losing his job while a family is saving $1000.  But remember it’s a numbers game.  Maybe there are a tens of thousands of people (and that seems high to me) in the oil industry who lost their jobs.  But there are a hundred million people who are getting a small benefit.  It’s a numbers game and the masses, with their small benefit, clearly make up for the relatively small amount of people who get crushed.


Final verdict

So if you look at all that, clearly the fall in oil prices should be a good thing for the economy.  And largely it is.  The nation is pulling out of a recession and there is broad-based economic growth.

But there’s still a nagging voice that is saying “not so fast”.  The problem with oil prices isn’t that it’s low now and a while ago it was high.  We have an amazingly adaptive economy that can thrive with low oil prices just as easily as it can with high oil prices.

What screws things up is when oil price change so quickly.  As I briefly mentioned earlier, starting up a new oil well is a major undertaking, and “major undertaking” is French for “expensive”.  Before a single drop of oil comes to the surface, companies are investing tens and hundreds of millions of dollars.

Of course, they would only do this if they thought they could generate a profit.  If oil was at $100 then they would look at all the places that can profitably produce oil at $100 and start getting to business.  Now they aren’t dummies and they know oil prices can move, so there’s a risk involved but that gets factored in too.  But when the bottom falls out of the price of oil and those wells become unprofitable, at some point they have to shut down the well and much of that initial investment gets lost.

And it’s not just oil producers.  Look at a company like Tesla.  They make electric cars, and as you can easily imagine, electric cars are really attractive when oil prices (and thus gas prices) are high.  You can see it in their numbers: sales have slowed down considerably as oil prices as fallen.  Just like the oil producers, the fine people at Tesla need to figure out if they should expand, make a new factory, all that stuff.  If they did that when oil prices were high (which in fact they did) then a lot of that investment might be in trouble now that oil prices are low.

Making it even more local, imagine your neighbor was looking to buy a new car.  When gas prices were high she was considering a Nissan Leaf (about $30,000) instead of a Honda Civic ($18,000), in large part to take advantage of savings on gas.  She buys her Leaf figuring she’ll save $2000 per year on gas, but then gas plummets and her savings are only $1000.  Her “investment” of the extra $12,000 she spent on the Leaf is in bad shape.


To bring this home, I think it’s unquestionable that lower oil prices are a good thing.  Yeah, a few people might get hurt, but that’s pretty small compared to the masses that are helped.  But the real problem isn’t high or low oil prices, but it’s unpredictable oil prices.  That’s when people or communities or companies make large investments which might turn out to be really bad decisions.

What about you?  How is the low cost of oil impacting you?

2015 was an awesomely tame year for inflation

inflation

About two weeks ago, the US government published their final inflation numbers for 2015.  The inflation number for the year was low, really low, like 0.1% low.  This is a crazy low inflation rate.  Just to put that in perspective, since 1950 (the year Grandpa Fox was born, incidentally) there have only been two years that have had lower inflation readings, 1955 (-0.4%) and 2009 (-0.4%).

The low inflation numbers were primarily driven by the plummeting oil prices, and how that has translated to cheaper gasoline and, to a lesser extent, cheaper home heating costs as well as things related to oil prices like airline tickets.  Those costs were low enough to offset price increases in areas like housing and food.

This is all well and good, but what does it matter?  As a loyal Stocky Fox reader, you’re probably asking the more important question, “Is the low inflation good for me or bad for me?”  There’s a lot of debate on this issue about what the optimal level of inflation is for the larger economy.  Obviously inflation that is too high is bad, but many also argue that inflation that is too low is bad as well.  There’s a lot of deep water there that I won’t tackle in this post.  But if you look at things purely from a personal perspective of you being a saver, low inflation is always good and the lower the better.


How much is a 0% inflation year worth to you?

Let’s use an example of Mr Grizzly.  He’s a spry 30-year-old who starts saving $1000 per month, has an average investment return of 6% but faces inflation 3%.  By the time he’s 65, his honeypot will be worth about $1.4 million, but as we know because of inflation that would only be worth $500,000 in today’s dollars.  That’s still a lot of money, but inflation certainly took a big bite out of it.

Obviously we know that the impact of inflation can be enormous (and I maintain, it’s overstated), and if we assumed inflation was 2% instead of 3%, then his honeypot at 65 would be worth $710,000 in today’s dollars instead of $500,000.  That’s powerful stuff.

But that assumes for several decades that inflation is lower.  Who knows what the future holds.  In the past 30 years (1985 to 2015) inflation has averaged about 2.7%, but in the 30 years before that (1955 to 1985) inflation averaged 4.6%.  Those are big swings and show how hard it is to predict inflation over really long periods of time.

Let’s look at Mr Grizzly’s situation again.  Remember he’ll have $1.4 million when he turns 65, but that’s only worth $500,000 in today’s dollars.  That’s assuming ever year has 3% inflation, but what if one of those years was a 0% inflation year.  Just one year.  All the other 34 years stay the same, but only one year changes.  This is kind of like the scenario that just happened in real life, 2015 had 0.1% inflation and then assume the next 34 years go back to that 3% average.  In this case, the impact of that one year of no inflation increases his $500,000 by about $15,000!!!

Doesn’t that seem like a lot?  Mr Grizzly didn’t save any more nor did he invest any differently.  He just looked at the inflation number and saw that in one year during his investing lifetime, inflation was zero.  And for that effort, his honeypot will be worth $15,000 (in today’s dollars) more to him than it would have otherwise been.  That’s a 3% increase!!!

Buried-Treasure
A low year for inflation is like buried treasure if you are an investor.

The point of all of this is as investors, we got handed a nice little gift from the investment gods in 2015 in the form of no inflation.  While most people are understandably focused on their returns, which in 2015 weren’t all that hot, there’s not nearly the attention given to inflation.  But we can see from the example with Mr Grizzly that this can be a really positive effect.

So there you go.  I always root for lower inflation, and I was super stoked to see it stay so low, to the degree I trust the CPI readings.

January 2016—putting it in perspective

Cartoon-Leopard

You may recall a couple weeks ago that my mother-in-law, Mimi Ocelot, wrote an email expressing concern that the stock market was going to hell.  It was pretty understandable.  Two weeks into the new year and stocks had fallen 9%.  Wow!!!

Now that the month is over, let’s take a look at things and try to put them all in perspective.  How bad was January 2016 for investors?


Remembering the first two weeks of January

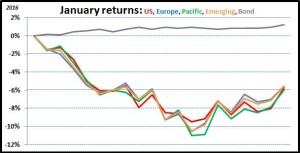
First, let’s just quickly recall how the month started.  After two weeks it was down 9% and then by Tuesday of the third week, it dropped even more, bottoming out at 11% below where things started for the year.  As you may remember, we looked at how bad that those first two weeks were from a historic perspective.

Since 1950, there had been 19 other two-week periods that were as bad as the first two weeks of January.  One way to look at it is there have been 1716 two-week periods since 1950 (66 years times 26 two-week periods per year).  So if 19 of those 1716 two-week periods were worse, that means things were worst about 1.1% of the time.  Any time something is in the 99th percentile of badness, that’s a big deal.

It was a tough couple weeks with everyone on TV has having a hissy fit about how the stock market was just terrible and all sorts of other crap.  And then this happened . . .


How the month ended

Capture

As I said, the third week started tough, dropping another 2%, but then things started to turn around.  By the end of the third week the market had gained 4% off its lows, finishing only down 7% for the month.  In the fourth and final week of the month, stocks had another good week, increasing about 1.5%.  So after all the carnage, stocks finished down about 5.5% for the month.

A month that is down 5.5% is obviously not a good one, but how bad is it really?  If you look at that same data from 1950, there are 792 months.  How many of those 792 months do you think were worse than January 2016?  If you guessed 66, you’re a winner!!!  66 seems like a lot actually.  That’s about 8% of the time.

Hmmmm.  66 months have been worse than this January.  66 times over 66 years.  That means that on average we have a month this bad once a year.  The last time we have a worse month was August 2015, and before that was May 2012, and then both August 2011 and September 2011.  How many of you remember any of those months as being really bad months for investing?  I’m guessing no one, and that’s the point, right?  During the time, it was probably bad, but then we moved on and the stock market continued its relentless upward trend.

Of course things are never steady and predictable with the stock market.  From 1990 to 1997 we had an eight year streak without a month as bad as January 2016.  Other recent streaks were five years starting in 2003 and most recently a three-year streak starting in 2012.

Conversely, in the depths of the Great Recession, in a six-month period starting in late 2008 there were FIVE months that were all worse than the one we just had.  Five out of six is bad.  OUCH.  And you know how that ended—everyone freaked out but those who kept their cool saw their investments completely recover and then some.


The point of all this is that the stock market has wild swings, and I have argued that the swings have gotten wilder in recent years.  At any given moment things may look crazy, but time has a way of evening this stuff out.  After two weeks it looked awful for the stock market.  We had a 99th percentile train wreck on our hands.  Two short weeks after that, things went from 99th percentile bad to 92nd percentile bad.  That’s a pretty big difference, a big improvement.

So as we wrap up January, no point sugar coating it, the month sucked for investors.  But also let’s not press the panic button either; months like this happen pretty frequently.  I hope that helps you sleep better at night.

Stocky’s 2015 performance

happy-new-year-blue-greeting-card-d-numbers-balloons-confetti-45166483-compressed

We talk about investing a lot and what you should do or what the historic data says is likely to happen.  But the rubber does eventually hit the road and real investments are made.  So now that 2015 is over, how did the Fox family do with our portfolio?  It only seems fair to ask.


Investment performance

From an investment performance perspective, 2015 was definitely a subpar year.  If historic returns are about 6-8%, we were well below that, sadly even dipping into negative territory for a couple investments.

Investment

Portfolio weight (beginning of 2015)

Portfolio weight (end of 2015)

2015 return

US stock index

33%

43%

0.3%

International stock index

35%

36%

-4.4%

REIT index

11%

11%

2.4%

Commodities

8%

5%

-28.2%

Medtronic

9%

1%

8.1%

Bonds/Cash

4%

4%

0.4%

TOTAL      -3%


As you can see, pretty much all our investments were either flat or fell in value.  Luckily, Medtronic had another good year, but even that wasn’t enough to compensate for the losers.

If you put it all in the pot and mix it up, our portfolio had a return of about -3%.  Obviously that isn’t what we want, and returns like that aren’t going to make the Fox family secure in its retirement and other financial goals.  But it’s important to keep in mind 2015 was the first down year since the disastrous year which was 2008.  That was a 6-year winning streak, so it’s probably reasonable to expect that to end.  Fortunately, if you were going to have a down year, this one was pretty benign as those things go.


Changes in investment weightings

If you read this column regularly, you know that in 2015 we had two major life changes that had a big impact on our finances.  First, I quit my job at Medtronic, and second Foxy Lady got a job in North Carolina which sent the Fox family east.  If you look closely you can see the impact of those events on our portfolio pretty clearly.

Because I quit Medtronic all my stock options and company stock developed a “use it or lose it” quality.  So I exercised all my options and sold nearly all my company stock.  We used that money to help with the downpayment on our North Carolina house (since it took longer than we expected to sell our Los Angeles house).  So because of all of that you can see why our Medtronic holdings really fell.

Also, anticipating my leaving Medtronic, I front loaded my 401k to make sure I hit the $18,000 max before I left.  Since my 401k was all in US stock index funds (that had the lowest management fee), plus since Foxy Lady’s 401k is similarly all in US stock index funds, that led to the increase in the percentage of our portfolio that is in US stocks.  That and the fact that US stocks outperformed international stocks.

Finally, we did add another investment to our portfolio—Lending Club.  This definitely deserves its own post, but basically it’s a peer-to-peer lending website (so I grouped it with “Bonds/Cash”).  Right now it’s a small amount of money, but Foxy Lady and I have gotten our feet wet and like performance we’re seeing from this investment, so we’ll be increasing it over time.


Net worth increase

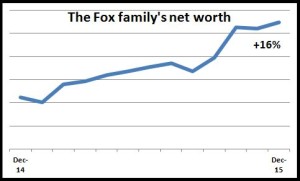
So all that’s great, but the bottom line is the bottom line.  What happened to our net worth in 2015?  Fortunately, despite a lower market dragging things down, our net worth was able to grow about 16%.

net worth graph

How is that possible, you ask?  Well, it’s just good ole saving money.  As I mentioned a couple paragraphs above, Foxy Lady and I both max out our 401k accounts, that being the primary way we save these days.  So despite the stock market not being very loving this year, we were able to offset that by putting more money in.

And as two foxes in our late 30s (Foxy Lady just glared and said “37 is clearly still considered mid-30s”), I actually look at this market dip as a bit of a good thing.  Using dollar-cost averaging, our 401k accounts were able to buy the same mutual funds we always did, but this time we were able to do so at a bit of a discount from what it would have cost before.

As you all know, I am incredibly optimistic about the future of the US and the world and the stock market.  So I know things will go up over the long haul.  If in the meantime I can buy some investments on the cheap, all the better.


That’s how we did with our portfolio.  The investments weren’t great, but we kept our nose to the grindstone and kept plugging away, which is really the most important thing you can do when saving for retirement.  How about you?  How did you do in 2015?


What’s causing the volatility? Part 2

Welcome back.  Yesterday I started listing off reasons we’re seeing so much more volatility in the stock market. In this blog I’ll take you home.


 “Skynet becomes self-aware at 2:14 a.m. Eastern time, August 29th.” –Terminator 2 (1991)

Terminator 2 - 5

Computer-initiated trading drives a major, and increasingly larger, portion of the volume in stock markets.  It’s a good thing for a few reasons.  It gives people more options in their trading strategies, it offers precision that humans can’t match, it doesn’t get tired or forget or anything like that.  But it also leads to a lot of volatility.

One of the major types of automated trading is “stop-loss” trades.  This is when someone owns a stock like Nike and says something like: “I only want to sell it if it starts to fall.  Right now the stock is at $50, so sell it if it goes below $45.”  Emotionally it makes sense.  Everyone knows crazy things can happen with stocks and it can all go to hell in the blink of an eye (see: Enron or Worldcom or Blackberry).  So as the name implies, this stops your losses at some level you establish.  Awesome.  You have more control.

The reason this increases volatility is that this type of trade tends to compound the problem.  When stocks are going down these stop losses trigger which sells more stock which drives the prices down further which triggers more sell orders and so on and so on in a downward spiral.  The obvious flaw is that the computers which are doing this don’t have any idea of the intrinsic value of the stock they are selling; they just know they are supposed to sell when the stocks hit a certain level so that’s what they do.

When rational humans look at these types of situation (maybe like Boeing on July 12) and can “see” that the market is overreacting, things tend to go back to levels that make sense.  Probably the best example of this is the Flash Crash of 2010.  On May 6 of that year, probably the craziest 30 minutes ever of stock trading occurred.  In a matter of minutes the market fell about 10% (equivalent to about 1700 points on the Dow Jones Industrial Average if this happened today!!!), and then just as quickly recovered nearly all the loss.

What made it so crazy was that no news drove it.  Maybe news of a nuclear war starting or a meteor on a collision course for earth would justify such a rapid move.  Of course there wasn’t that, but there wasn’t anything—no news from the Federal Reserve, no companies going bankrupt or countries defaulting on their debt, or a regional skirmish, or a refinery blowing up, nothing.

In the aftermath, the leading theories all ultimately pointed to automated trading.  Some sell order lowered prices slightly but just enough to started triggering stop-loss orders.  That started a selling frenzy that drove prices down, leading to more stop-loss orders and in an instant everything went to hell.  Once thinking people saw this and knew that something weird was going on, they started buying those shares which were selling at 10% or 20% or even 50% less than they were 20 minutes before and made things normal again.  Like so many examples here, we ended where we started, but we had a crazy ride in the meantime.  More volatility.


“We keep inventing better ways to kill ourselves”

The stock market is an evolving landscape.  There was a time long, long ago when it was just stocks.  Then derivatives like options and futures came along as well as buying on margin (borrowing money to buy your stock); and now we have stuff like credit-default swaps (I can’t say I fully understand those), virtual currencies, and other really exotic things.  Like a gun or a power saw or a car, these financial tools can be very useful when used correctly but they can be disastrous when used recklessly.

Generally speaking these investments lead to higher volatility because they tend to be very leveraged.  You can make really, really large investments without a lot of money.  To buy 1000 share of Medtronic would cost you about $75,000; but to “buy” that same amount using call options would cost maybe something like $2000.  Of course, derivatives like stock options are much more volatile, and can lose all their value really quickly.

All the sudden that means you can be a small-time investor who decides to throw a Hail Mary in the stock market.  Instead of needing a bunch of money to take a major position, you could do it with much less.  Realistically, I as an individual probably couldn’t take such a big position to impact the market, but certainly a small bank could.  There are dozens of stories where some trader at a bank took a crazy big position, often times using derivatives, that went bad.  Not only does it take the bank down, but when that bank falls, just like dominos, others fall with it.  Same story: increased volatility.


So we’ve covered a lot of ground and come up with a lot of things that make today’s stock market much more volatile than it’s ever been in the past.  But let’s remember that the stock market is ultimately about fundamentals.  How strong are the companies?  Are they coming up with new products?  Are they finding better, faster, cheaper ways to meet our needs?  Those are the things that make the stock market go up over time.  And I believe all those things are there in today’s stock market.

In fact, of all the reasons I cited for increased volatility, I think all of them are good for the long-term value of the stock market.  Information traveling faster is a good thing; a globalized economy is a good thing; computer assisted trading is a good thing; financial derivatives are a good thing.  They’re all good and they all are making stocks continue to be a good investment.  Remember, stocks have been on a relentless climb for over a century.  In 2015, despite all the craziness, we were still hitting new all-time highs.

Sure, sometimes people screw things up, and because of this new age, those mistakes make a big impact.  But that big impact fades, usually very quickly.  So Mimi, as always, I think the stock market has great prospects for the long-term future, and I’m putting my money where my muzzle is on this one.  Your daughter-vixen’s retirement money as well as your grandcubs’ college funds are fully invested.