I’m trying to build my audience, so if you like this post, please share it on social media using the buttons right above.
The financial story of the past six months has certainly been inflation. After many decades of unprecedentedly tame inflation, starting this April inflation shot up and is now at over 6%. Four years ago I even made a pronouncement that “Inflation was dead”. How could I have been so wrong? Or was I?
To put things in perspective, let’s go back to 1992, after the US had “recovered” from the first Iraq war under the first President Bush. From then to last year, 1992 to 2020, 28 years, a generation, a lifetime in the investing world, inflation averaged 2.4%. Over those 28 years there were just six years where inflation was higher than 3%. Frankly, I think we got a bit spoiled.
How will this affect my investments?
But really, who cares about inflation, per se? What we really care about is how it impacts our investments and our retirement plans. When it’s all said and done inflation isn’t all that bad if your investments grow faster than inflation.
This year, inflation is at about 6%, but the stock market is up about 20-25% (depending on the day you look—wow it’s been a crazy market the last few days). That means the real return (stock return minus inflation), how much more “stuff” you can actually buy, is up about 15-20%. That’s an amazingly good year that investors will always take.
Typically when inflation is high that’s bad for the economy. There’s a lot of deep water there and economists much smarter than I are debating that all the time. But the chart below shows over long periods of time it’s not that simple.
Stock return
Inflation
Real return
1950s
18.2%
2.0%
15.8%
1960s
8.6%
2.4%
6.1%
1970s
5.7%
7.1%
-1.3%
1980s
17.4%
5.5%
11.3%
1990s
19.4%
3.0%
15.9%
2000s
-1.0%
2.6%
-3.5%
2010s
13.8%
1.8%
11.8%
The 1970s had the highest inflation, and that was a terrible time for the economy and therefore for stocks. But the 2000s were also a horrible time for stocks even though inflation was very low.
Inflation makes your portfolio riskier
As someone investing for their future, the problem with inflation is that it forces you into stocks. Stocks are a natural hedge against inflation because you don’t own pieces of paper with green ink (cash), or the promise to get pieces of paper with green ink in the future (bonds).
Rather you own “stuff”—real estate, buildings, patents, factories, etc. As the price of things go up, the very definition of inflation, the prices of those things you own also goes up.
It creates this precarious balance between hedging against inflation and having the proper asset allocation. It’s like you’re driving on a mountain road but now instead of the cliff just being on one side, it’s on both sides.
What to do?
The jury is still out on this, but things look precarious. I always tend to be more aggressive with asset allocation, so I’m 100% in on stocks, and that’s how I’ll keep it. But we’re in our mid 40s so we still have decades to ride out any nasty storms. If I was in my 60s it would be a much tougher decision.
I’m trying to build my audience, so if you like this post, please share it on social media using the buttons right above.
Sorry for the extended absence from writing the blog. Like many of you foxes and vixens, I have been homeschooling the kits, and that has kept me pretty busy (and on the brink of sanity). The boys started school last week (they go to school two days per week and do remote learning three days per week), so that gives me a little bit of time to get back into the swing of things with my blog.
Picking our way out of the rubble
2020 will obviously be remembered as the year of Covid. They year is not over yet, and we still have a presidential election. But I sure hope that nothing else this year can supplant Covid for the title of “Craziest Crap to Happen in 2020”. I’m a bit nervous.
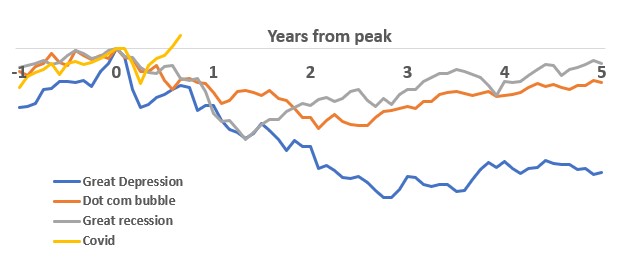
From a personal financial perspective, this was on the Mt Rushmore of stock market calamities, along with the Great Depression, the Internet Bubble, and the Great Recession. At the depth of the freefall in March, the Covid market was actually worse than the Dot-com burst and the Great Recession. And not just by a little bit: Covid was down 20% while Dot-com and the Great Recession where down 13% and 11% respectively at that same point in time.
However, a few months later everything is as good as it was before the nightmare started—actually better. Today, stocks are higher than they were before the Covid hit the fan.
You know how they say “a picture is worth a thousand words”? Here is a picture that shows those four stock markets. Crazy, huh?
We’ll remember this one for a while. In March, the speed and severity of the fall was matched only by the Great Depression. When you have to go all the way back to the Great Depression to find a similarly horrible market, you know you’re dealing with some serious stuff.
Yet, the recovery was arguably more extraordinary. Those other examples had a downward slide measured in years, not months. At it’s worst, the market lost over half it’s value. But what really puts the cherry on top for me is the time it took to recover. Those other markets took years (decades in the case of the Great Depression); Covid just took a couple months.
After 3 months
Nadir
New high
Great Depression
-34%
-83% after 3 years
25 years
Dot-com bubble
-13%
-46% after 2 years
12 years
Great Recession
-11%
-53% after 1 year
5 years
Covid
-20%
-20% at 3 months
7 months
Covid market in perspective
I don’t think in March anyone would have predicted something like this. Personally, I thought we’d be at 3000 on the S&P 500 by July (about 10% down from the market highs). At the time, I thought I was crazy optimistic. As it turned out we were at about 3200, a new high.
That said, this one will leave a scar. No matter how optimistic one is, it will be impossible not to remember that hollow feeling investors had in their stomachs in March. If you were able to keep your head this turned out to be inconsequential. If you sold then you really did yourself a disservice with regard to wealth building.
I imagine that along with the Dot-com and Great Recession, the Covid market will be responsible for thousands of people not participating in the market. They say, “I remember Covid and I just don’t trust the market.” They’ll not invest and really hamper their ability to generate a large nestegg. I suppose we’ll see on all this stuff.
That said, I’m glad we’ve made it out the other end on this okay.
For most investors March could not have ended soon enough. Stocks were down 12.5% (actually I thought it would have been worse, but we’ll talk about that more in a second). Obviously that’s bad, but since 1929 there have been 18 months that were worse.
With emotions running high as the stock market plummets and, more importantly, as the body count from the coronavirus rises, it’s important to use data to put everything in perspective. Let’s dig into what the numbers say.
Ultimately, I am optimistic. Also, as bad as it is right now, it has been worse and we’ve made it through. Hope this post makes you feel better.
Things feel pretty bad right now
As we said above, March was the 18th worst month for the US stock market since 1929. What makes it feel worse is that February was down 8.4%, the 84th worst month. That’s a helluva one-two punch. But even then, this was only the 13th worst two-month period for stocks.
I say all this because what we have gone through has been bad, really bad, historically bad. But it has been worse; many, many times it has been worse. The optimist in me says if we survived all those other times, then we’ll survive this one too.
Light at the end of the tunnel
I have absolute confidence that things will get better, the pandemic will fade, the US and the rest of the world will start making enough tests and masks, and ultimately the stock market will recover. The only question is when.
If you believe, as I do, that the stock market is a good clearinghouse for national/global sentiment on how we’re doing with this pandemic, there is reason to be optimistic. Since April stocks are up 3%, largely driven by yesterday when stocks were up over 7%. Certainly that’s good news, and we all hope that new cases will start to decrease, recoveries will start to increase, and American industry will provide the tools to really finish all this coronavirus business.
Also, as this stretches out, it helps to better and better put what we’re going through into perspective. It has now been almost seven weeks since we were at our stock market high (Feb 19). Since then stocks have fallen 21%. Any guesses how many times this has happened in the past . . . 17. That seems like a lot. In the past 100 years this has happened 17 times. That’s about once every six years. Of course, it’s not nearly that regular. The Great Depression accounted for a lot as did the Great Recession, but still.
Also, as we start to stretch the time horizon out we start to see different periods of history that had similar stretches. We have all the usual suspects: over half of those time periods were in the 1930s, plus one from the dot-com bubble (2002), one from 1987, and one from the Great Recession (2008). But now that we’ve been at this for almost 7 weeks we have a new member to the club: May 1970.
The 1970s were a horrible decade for investing. We had the Vietnam War, oil shocks, the Nixon resignation, sky-high inflation, an ineffectual Jimmy Carter. There wasn’t any one event, but rather that decade was just a long grind of bad.
Let’s wrap this all up. Back a few weeks ago the market was in total freefall and it was scary. But after the initial onslaught things have stabilized. In the past two weeks, the S&P 500 has traded in a fairly tight range (2400 to 2700), so things seem to have stabilized a bit. Now it’s just turning out to be a bad market like the ones we get every generation or so.
Inherent in investing is risk. The psychology of stock markets doesn’t allow the air to seem out of the balloon slowly. Rather, it tends to favor a violent burst. That’s what we’re going through right now. But I do think there is a light at the end of the tunnel.
Making predictions on the stock market it a great way to look stupid. When we first started this, I thought we’d be at 3100 by the end of May. That’s looking less and less likely, but I do think we’ll be at 3000 (down about 10% from our highs) but the time we celebrate the US’s 244rd birthday. We’ll see if I’m right.
I’m trying to build my audience, so if you like this post, please share it on social media using the buttons right above.
Holy Crap!!! That’s
really the only appropriate response to the craziness of the stock market over
the past few weeks. So over-the-top has
been said craziness that I just couldn’t sit on the sidelines any more. I had to get my stocky back on.
Let’s dive in with what’s really going on, how crazy is all this really, and if you should be freaking out?
The numbers
Let’s try to remove emotion from the craziness of the stock
market for the past few weeks and just look at the facts, the numbers.
On February 19, the stock market* peaked at 3386. The next two days it fell a bit, but then on
Monday, February 24, it slipped over 3% and the freefall began. Since then it has plummeted to 2711, a 20% decrease. That’s a crazy fall but let’s put that in
perspective.
First, before all this began, the stock market was up a bit
less than 5% for the year (not bad for two months). So really we’re just down about 16% year-to-date. That’s certainly not good, but being down 16%
feels better than being down 20%.
Second, despite all of this, we are up about 9% from where
we were at the beginning of 2019. Going
back five years, and the market is up about 32%.
You get my point. This is definitely bad, but I think one of the things that makes it so bad is that the pain has been so focused. Who knows what next week will bring (I am writing this Sunday night after the cubs finally went to sleep). Maybe the market is taking another dump on Monday morning as you read this. But those historical numbers seem decent. If someone told you at the beginning of 2019 that stocks would be up almost 10% over the next 15 months, I think you’d probably take it.
Historic context
The past three weeks (17 trading days) have been bad, even
by historical standards. But how bad
really?
In the past 17 days we are down 20%. Since 1928, there have been 15 other periods
that bad or worse. Over 90 years, this
has been worse 15 times. That doesn’t
seem all that bad, actually.
Of course, that doesn’t mean this happens every six years or
so. It’s much more lumpy. As you would probably guess, most of those 15
periods come from the Great Depression, eight of them in fact. That accounts for half of those
instances. Needless to say, the Great
Depression was a colossal
economic calamity the likes of which we’ve never seen since. This is not going to be another Great
Depression. Not anything remotely close
to that.
The others are a smattering of instances around World War II
(1937, 1938, 1940, 1946), the biggest single day fall in the stock market’s
history (1987), the dot-com bubble (2002), and the Great Recession (2008,
2009).
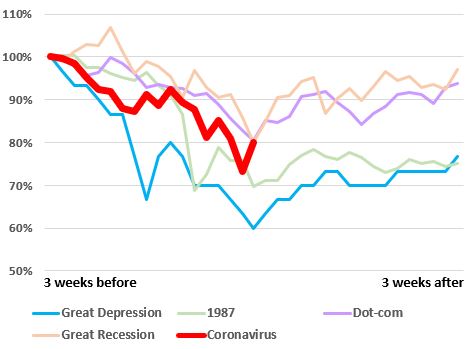
This time seems a bit middle of the road compared to those mega-examples. The graph shows the stock market in the three weeks before the you-know-what hit the fan and the three weeks after. What we are going through today is in the bright red line.
This gives me a bit of comfort. Coronavirus had a steeper fall than most, after
three weeks (where we are today), it was as good or better than any of those
examples. In the following three weeks
thing improved in every case (for the Great Depression it got a bit better as
you can see, but then the bottom really fell out).
Of course, it’s impossible to predict the stock market, but I tend to think things aren’t nearly as bad as the stock market’s performance would lead you to believe. Let’s say I’m 70% optimistic and 30% pessimistic.
The argument for stocks recovering quickly
If you compare what we’re going through to the dot-com
bubble and the Great Recession, I think we’re in a lot better shape.
In each of those examples, there were fundamental and
systematic problems with the stock market and the economy. In 2002 there was rampant accounting fraud (Enron,
Worldcom, Qwest, etc.) that made it impossible to invest based on trustworthy
information, the lifeblood of the stock market.
In 2009 the banking system was collapsing, threating to grind the wheels
of commerce in the US to a halt.
Coronavirus just doesn’t seem all that bad in
comparison. Those were deep, dark issues
that took a long time to unwind and correct.
That doesn’t seem to be the case here.
In the next few weeks the number of new cases will peak. Social distancing, warmer summer weather, and
the miracles cooked up by the pharmaceutical industry are going to fix this.
If you look at data from China (not a good idea since I don’t
trust their data) and South
Korea (I trust their data more), this doesn’t last very long. South Korea started getting cases on February
19, and the US started getting cases on March 2; so we’re about two weeks
behind them. Their new infections peaked
on March 3; if ours follow suit we should be peaking this week. Even if it takes us twice as long to peak,
that’s only another few weeks. That
doesn’t seem all that bad.
Things are starting to turn for Koreans positively in other
ways too. People are starting to recover
to the point where the total number of people infected is flat—every day just
as many people are considered fully recovered as there are new cases. Also, their death rate is falling precipitously.
Even if it takes us twice as long to peak and then flatten
as it did in South Korea, that’s only another few weeks. That doesn’t seem all that bad. It’s definitely better than the Armageddon scenario
that seemed to be priced into the market right now.
Going into this, the economy, especially the US economy, was
quite strong and there’s no real reason to think that will change. Banks aren’t going to start much stricter
lending regulations as was the case in 2009.
You don’t have entire industries that we thought were very profitable
and now we know are unprofitable as was the case in 2002.
Once we get the all-clear, there’s no real reason to think things won’t go back to normal, or maybe even better than normal as we work off some of that pent-up demand.
The argument for stocks still facing trouble
As optimistic as things look for South Korea, they look that
bleak for Italy. Italy got their first
cases a few days after South Korea, but they have yet to peak. Everything is on total lockdown and there isn’t
an end in sight.
If we end up looking more like Italy than South Korea, that’s
bad, obviously. Reasonable people can
debate which is the better analog.
As it stands, in the US, the hits keep coming. Major components of industry are shutting
down (mostly sports, travel, tourism, and conventions). Very honestly, this became real for me last Wednesday. That’s when the NCAA announced fans wouldn’t
attend the basketball tournament (I had tickets) and the NBA cancelled the
season (the NBA playoffs are my Christmas).
On Friday we started an international travel ban. Yesterday our state joined many others in
cancelling schools for kids.
There’s an obvious human cost to all that, but there’s also
an economic cost, one that will never be recovered. You can’t get the revenue for those tickets
back, enjoy those cancelled cruises, fly on those cancelled flights. That’s all gone. At a minimum that’s probably 3-5% of the
value of the stock market.
And that’s if things go right. There’s a lot of reason to believe that other
industries might need to shut down. There’s
also a lot of reason to believe that this might take months rather than
weeks. As those things happen, it will
get worse for stocks.
So there you go. That’s my take on all this crazy coronavirus mayhem. Sadly, this has given a lot of material for future posts, so you should expect another post from me on Wednesday. Ha, ha!!! That’s not sad, that’s great news.
*Unless otherwise stated, I’ll be using the S&P 500 when
I refer to “the market”. For stock data
before 1950, when the S&P 500 began, I am using a “proxy” of the S&P
500 that Yahoo!Finance has created going back to 1928.
I’m trying to build my audience, so if you like this post, please share it on social media using the buttons right above.
A couple years ago, th I did an a analysis that showed that the stocks market has gotten MUCH MORE volatile in recent years. Since then, it’s gotten even worse. That begs the question–why has the stock market gotten so much more volatile?
“Ready, Fire, Aim” –Tom Peters (1982)
Nearly everyone agrees that information is the lifeblood of the stock market. Today, that information travels so much faster than in the past. Something could happen in the most remote corner of the world, and you would know about it in everywhere in a matter of seconds or minutes. Obviously quicker access to news is a good thing for society at large, and investing in particular, but it definitely exposes many investors to making big mistakes because they are acting so quickly.
A good example is July 12, 2013. On that day a Boeing 787 caught on fire a Heathrow Airport in London. Here’s some quick historic context: the 787 was Boeing’s next generation aircraft that was going to revolutionize air travel, a plane Boeing pretty much staked its entire future on. In early 2013 two 787s caught fire, leading to the FAA and its counterparts around the world to ground all 787s until Boeing figured out the problem. Boeing’s stock, as you would expect, got hammered. It took Boeing several months, but they fixed the problems, got the 787s in the air again, and their stock recovered.
Then July 12 happened. News broke that another 787 caught on fire. Investors, understandably, concluded that the problems weren’t fixed after all and that the planes would be grounded again. In a matter of minutes the stock cratered, falling from about $108 per share to $99. Over the following hours and days, it became clear the July 12 fire had nothing to do with the previous problems; it was just one of those things that do happen every once in a while. No big deal. Two weeks later, Boeing’s stock was back to the pre-July 12 fire levels. It was all like nothing happened; except it did happen and there was crazy volatility in the stock.
The morale of the story is that investors got the information so quickly and rushed to act on it so quickly, that they completely misevaluated the situation, and that led to a lot of volatility. Had the news traveled more slowly, the world would have had more time for more of the facts to come out. No matter how you slice it, the light-speed fast news makes the pace of investing faster, and when you do something faster, you tend to make more mistakes.
“The chief business of the American people is business” –Calvin Coolidge (1925)
We Americans are probably a bit spoiled. There have been no wars fought on our soil since 1865 (I didn’t count Pearl Harbor, which reasonable people can debate). There has been a consistent government since 1787 (or 1865 depending on how you think about the Civil War) without any coups or revolutions. There’s never been a military takeover of the government, and the US government has never defaulted on its debt. You could go on and on.
The reason that is important is that today about one third of all earnings in the S&P 500 come from outside the US. It’s hard to find out what that number was in 1950 or 1960, but suffice it to say that that number was much, MUCH lower back then. So we have a lot more international exposure now than in the past.
That’s a good thing because of diversification. But it does expose us as investors to some of the geopolitical challenges that I just mentioned, that the US has been blessed to have avoided.
Also, to President Coolidge’s quote, the US tends to be oriented towards business (and some, but not I, would argue too oriented towards business). This has definitely helped us become the largest and strongest economy in the world. But other countries have other orientations (I’ll try not to use too blatant of stereotypes to offend my international readers): the Middle East is very theocratic, Japan focuses on saving face (keeping it from writing off bad debts which has stalled its economy for two decades), China is very authoritarian, Europe is more socialistic. That doesn’t mean any of those other perspectives is bad. But it does mean they are less likely to drive greater business and productivity, and those are not good if your goal is to have your stocks grow.
If you’re exposed to those geopolitical landmines as well as those competing priorities, it shouldn’t be surprising that the road won’t be as smooth. And that’s just French for saying more volatility.
“The world is getting smaller” –Mark Dinning (title of a song from 1960)
Somewhat related to the above issue, the world is getting smaller (don’t think the irony is lost on me that a phrase we use to describe how fast the modern world is changing came from a song two decades before I was born). Everything is so much more connected now, whether it be products (your car is connected to the internet which depends on satellites and under-water fiber optic cable) or countries (the components for your phone probably came from a dozen different countries).
All that interconnectivity is a good thing. It means people/companies/nations can specialize in what they do best, allowing us to get the best products and services at the lowest prices. But that connectivity also means that when the stone falls in the pond in one part of the world, the ripples hit everyone in some way, big or small.
Back in the day when the US economy was largely self-reliant, and even local economies were fairly independent, if crazy stuff happened across the world or even across the country, it didn’t affect things at home that much. That impacts volatility because something is always going crazy somewhere. And of course, that carries over to stocks which react to that craziness. Gone are the days when General Mills was a regional foodstuffs provider for the Midwest; now its stock is affected by the Los Angeles longshoremen striking, the drought in sub-Sarahan Africa, and the revaluation of the Argentine peso. Once again, more volatility.
This seems like a good stopping point. Come back on Monday, same fox time, same fox blog, for the exciting conclusion to “What the hell is going on in the stock market?”
Readers who’ve been following the blog for a while know that in early 2018 the Fox family had to go out on our own to get private health insurance. I did a three-part post on it here and here and here. It was a big change from always having had private insurance through our employers. But we did it.
Here’s how everything looks a year later. If you don’t want to read the whole thing
here’s the punchline: We had our sickest year in the past 5 years, but we still
came out ahead about $16k.
What we got
When we were looking at our different options, there were
two broad choices that we had to make.
We could go with a full-blown Obamacare plan that provided comprehensive
coverage for everything, similar to what we had when we got insurance through
our job.
Or we could go with a much more stripped down plan that
offered a high deductible, but put a cap on our expenses if some type of
medical catastrophe happened.
All four of us had always been relatively healthy, and since
the Obamacare plan cost about $2200 per month while the stripped-down version
cost $600 per month, it seemed like a no-brainer. We went with the stripped down version.
For a cost of $600 per month we got access to the health
insurer’s negotiated rates. Plus, there
was a cap of $25,000. If something
horrible happened we wouldn’t be bankrupted.
And on we went.
Just like all things, the first purchase we made probably
wasn’t the best. At the beginning of
2019 we weren’t rushed like we were the first time. I was able to shop around look at a lot of
different options. We found a similar
stripped-down plan, but this one only cost $450 per month and had a cap of
$3000—better coverage at a lower price. We
switched to that, and that’s what we have now.
How we used it
Of course, once we got on a stripped-down plan our two cubs
conspired to make this year the year we consumed more healthcare than any since
Lil’ Fox was hospitalized for four days with croup in 2012.
Foxy Lady and I had no health issues. We just did our normal check-ups. For the first few months everything was fine
and we didn’t have to go to the doctor at all, but then the dam broke:
Mini Fox broke his leg at one of those trampoline places. Total cost $1700
Mini Fox got a nasty cold and had to go to the doctor a couple times. Total cost $200
Lil’ Fox was the only one who wasn’t sick in the family in December but then he came down with a NASTY case of strider. We ended up going to the doctor about six times. Total cost $600
One of the times Lil’ Fox was really struggling breathing we had to go to the ER. They gave him breathing treatments and a steroid, but then sent us home in the evening. Total cost $2300
We had to get an inhaleable steroid for Lil’ Fox that was not on generic so it was fairly expensive (this is one of the places we would have saved a lot by having a full-on plan). Total cost $300
Lil’ Fox went to an ENT and found that his adenoids were very enlarged, and that was largely responsible for all the breathing issues he was having. Plus, his tonsils were infected and were the perfect place for nasty bugs to hang out, likely allowing his cold to persist. We took the adenoids and tonsils out. It was considered an elective procedure so we had to pay cash. Total cost $4000
Yikes!!! Those are
some big numbers. And of course, the
financial gods chose to humble our family by hitting us with all this the very
first year we went on our own for health insurance. Any one of those on its own would have been
more than we paid in any of the previous five years. I guess sometimes timing sucks.
Yet, we’re ahead of
the game.
But as expensive as all that stuff was for us out-of-pocket,
we actually ended up WAY AHEAD. How so?
Sure, we had to pay about $9000 out-of-pocket when you add
it all up. But that’s over a whole year
(14 months actually—from March 2018 to May 2019). And the key was that the coverage we got that
exposed us to those higher out-of-pocket expenses only cost about $500 per
month instead of the $2200 that an Obamacare plan would cost us each month.
Do you see where I’m going with this? Because I am a financial nerd, I track this
stuff obsessively. We paid $1700 less
each month in premiums ($2200 – $500).
If we took that money and stuffed it in a mattress, after 14 months we’d
have about $24,000. Subtract that $9000
in out-of-pocket expenses (actually it would be less than that because
Obamacare also has out-of-pocket costs), and you get about $15,000.
If instead of stuffing the extra money in a mattress, we invested
it in the stock market instead, so we ended up with $16k, rather than $15k.
That’s pretty powerful.
We got less insurance coverage but paid a lot less for it. Now we have a $16k buffer to take care of any
of those higher out-of-pocket costs.
Plus, our insurance does cover us for catastrophic expenses beyond $3000,
so it’s hard to see how we lose this game now.
To use a gambling analogy (and isn’t insurance really just another form
of gambling?), we’re playing with house money.
Long before there were ever stocks or bonds, the original investment was gold. Heck, even before there was paper currency or even coins, gold was the original “money”.
That begs the question, What
role should gold have in your portfolio?
If you don’t want to read to the end, my quick answer is “None”. However, if you want to have a bit of a
better answer, let’s dig in.
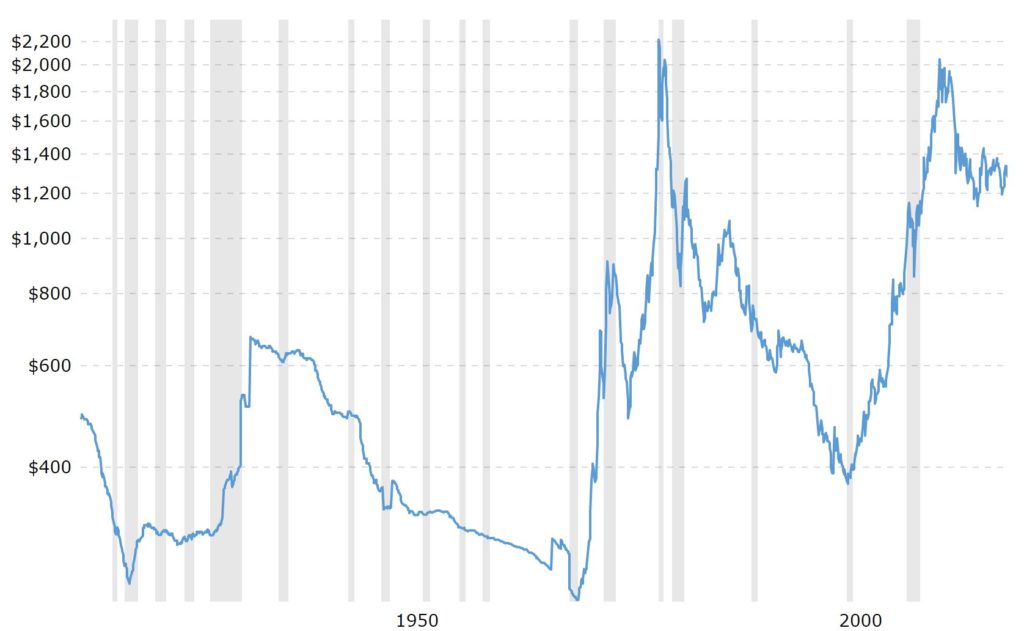
Gold as an investment
Just like stocks and bonds, gold is an investment. The idea is to buy it and have it increase in value. Makes sense. And historically, it seems to have been a good one—back in 1950 an ounce of gold was worth about $375 and today it’s worth about $1300. Not bad (or is it???).
However, there is a major difference between gold (and broadly commodities) as an investment compared to stocks and bonds. Gold is a store of value. If you buy gold it doesn’t “do” anything. It just sits in a vault collecting dust until you sell it to someone else.
That’s very different from stocks and bonds. When you buy a stock that money “does” something. It builds a factory that produces stuff or it buys a car that delivers goods or on and on. What ever it is, it’s creating something of value, making the pie bigger. That is a huge difference compared to gold, and it’s a huge advantage that stocks and bonds have over gold. You actually see that play out by looking at the long-term investment performance of gold versus stocks.
Golden diversification
Statistically speaking, gold gives an investor more diversification than probably any other asset. We all know that diversification is a good thing, so this means that gold is a great investment, right?
Well, not really.
Stick with me on this one. Gold
is negatively correlated with
stocks (for you fellow statistics nerds, the correlation is about -0.12). Basically, that means when stocks go up gold
tends to go down, and when stocks go down gold tends to go up.
Over the short term, that’s probably a pretty good thing, especially if you want to make sure that your investments don’t tank. In fact, that’s one of the reasons gold is sometimes called “portfolio insurance”. It helps protect the value of your portfolio if stocks start falling, since gold tends to go up when stocks go down.
However, over the long-term, that’s super
counter-productive. We all know that
over longer periods of time, stocks have a
very strong upward trend. If gold is
negatively correlated with stocks, and if over the long-term stocks nearly
always go up, then that means that over the long-term gold nearly always goes
(wait for it) . . . down.
That doesn’t seem right, but the data is solid. Look back to 1950: an ounce of gold cost
$375. About 70 years later, in 2019,
it’s about $1300. That’s an increase of
about 250% which might seem pretty good, but over 70 years that’s actually
pretty bad, about 1.8% per year.
Contrast that with stocks.
Back in 1950 the S&P 500 started at 17, and today it’s at about
2900. That’s an increase of about
17,000%, or about 7.7% per year. WOW!!!
Just to add salt in the wound, inflation (it pains me to say
since I think the data
is suspect) was about 3.5% since 1950.
Put all that together, and gold has actually lost purchasing power since
1950. Yikes!!!
A matter of faith
Fundamentally, if you have faith that the world will continue to operate with some sense of order, then gold isn’t a very good investment. So long as people accept those green pieces of paper you call dollars in exchange for goods and services and our laws continue to work, gold is just a shiny yellow metal.
However, if society unravels, then gold becomes the universal currency. The 1930s (Great Depression), the 1970s (OPEC shock), and 2008 (Great Recession) were all periods where gold experienced huge price increases. Those are also when the viability of the financial world order were in question. Each time, people were actively questioning if capitalism and banks and the general financial ecosystem worked.
People got all worked up and thought we were on the brink of oblivion. Gold became a “safe haven”. People knew no matter what happened, that shiny yellow metal would be worth something. They didn’t necessarily believe that about pieces of paper called dollars, euros, and yuans.
Yet, the world order hasn’t crumbled. Fiat currencies are still worth
something. Laws still work, so that
stock you own means that 1/1,000,000 of that factory and all it’s input belongs
to you. Hence, gold remains just a shiny,
yellow metal.
The bottom line is that stocks have been a great long-term
investment, and gold hasn’t. And that’s
directly tied to the world maintaining a sense of order. So long as you think that world order is
durable and we’re not going to descend into anarchy Walking-Dead style, then gold isn’t going to be a good investment.
So the survey says: “Stay away from gold as an investment in
your portfolio.”
2018 was an “interesting” year for stocks. Everyone wants to think “this one was
different” but 2018 did seem to be pretty crazy.
We had some wild swings pretty much the whole year: from January
to December. Going into December, I was marveling at what
a genius I was with my prediction from the beginning of 2018 that the market
would be up about 5% for the year. Going
into December it looked like I was going to be spot on . . . and then the
bottom fell out of the market and you have where we are now.
Our stock performance
Just like most everyone else, we had a down year. Of course, since we only invest in index
mutual funds, by definition whatever the market did is the return we got.
Investment
Ticker
% of total portfolio
2018 return
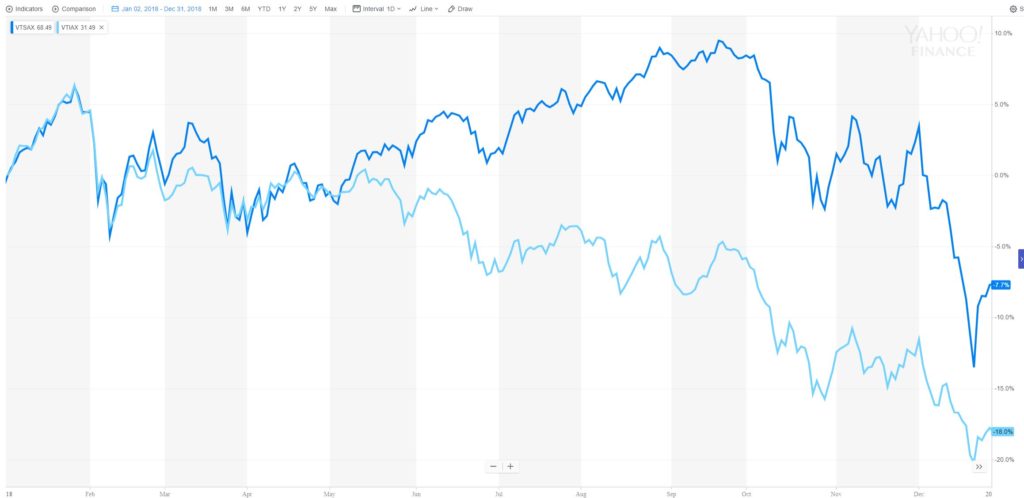
US stocks
VTSAX
50%
-8%
Int stocks
VTIAX
45%
-18%
REITs
VGSLX
5%
-12%
TOTAL
-12%
We were down 12%, and obviously that sucks, but . . . There’s really no “but” so let’s not try to
sugarcoat it, but maybe there is a silver lining. Since the Great
Recession in 2008, stock were up about 150% (about 11% annually) and had a
10 year winning streak.
Dark blue was US stocks (down 8%) and light blue was International stocks (down 18%)
This year we had a down year, so it’s a bit hard to
complain. Historically, stocks
are down for the year about 30% of the time. We were probably due, so we shouldn’t get too
greedy. Still, it isn’t fun to go
through a down market, but that’s life.
Notice any changes?
We also made a few simplifying changes to our portfolio
starting in late 2017 and continuing into 2018.
At the end of 2017 we sold all our commodities as I
discussed here. In 2018, we also
exited our Lending
Club investment which was also a disappointment (although not nearly as bad
as the commodities).
That took us from five investments (US stock index fund, Int
stock index fund, REIT fund, commodities ETF, and Lending Club) down to three. If you remember the post on Three Investing
Ingredients, I was getting closer to following my own advice. The only thing still there was REITs. In late 2018 we finally sold those off, so as
of now, we are totally following the Three Investing Ingredients. It’s nice to get back to basics.
At the beginning of 2020 when you read about how we did in
2019, there should only be two investments.
Inflation
The other thing I always look at at the end of the year is
inflation. US inflation came in at
2.4%. It’s been inching up steadily over
the past few years, and now it’s the highest it’s been since before the Great
Recession. Even so, 2.4% is still
incredibly low.
We spend a ton of time talking about the impact inflation
will have on your portfolio. A few years
back I even wrote almost a love
note to the investing gods for 2015 being a no-inflation year. The fact that inflation remains very tame
compared to historical standards—I use 3% as a target for inflation—means we’re
ahead of the game.
Wrapping it all up
Let’s chalk up 2019 to a crazy year and a “bad” year. But we know sometimes we have bad years. In the grand scheme of things it definitely
could have been worse.
MY 2019 PREDICTION—I think our new normal for the next several
years will be a lot of volatility, like we saw in 2018 and so far in 2019. I never like trying to predict the stock
market, but it just “feels” like we’re in for another down year. I predict down 7%. Of course I’ll use this as an opportunity to
keep socking money away and buy stocks at prices that in 10 years will look
bargains.
I’m trying to build my audience, so if you like this post, please share it on social media using the buttons right above.
This is probably the most common question you get from people who are considering starting to invest in stocks. It’s pretty understandable; you work hard for your money and the idea of it disappearing into the black hole of an unpredictable and often times not-well-understood stock market is pretty hard to stomach. Add on that scars from the 2008 Great Recession, 2001 Internet Bubble, Black Monday in 1987, Black Tuesday in 1929, and on and on and on. Even recently, 2018 has had a bunch of wild freefalls, including the one we’re in right now.
So, what’s the answer to the question: Who knows? The stock market is unpredictable and no one knows what will happen in the future. That’s not an especially satisfying answer, but it’s the truth. If I could predict the stock market I would own my own island in the Caribbean next to Johnny Depp’s.
But I can hear you saying, “Come on, you’re Stocky Fox. You can do better than that.” You’re right. I’m taking on the challenge and answering the question: Will you lose money with the stock market?
I won’t try to predict what will happen in the future, but I think you can look to how things have behaved in the past, and get a pretty good perspective. Of course, there’s no certainty that the future will be like the past, but that’s the best we have to look at.
You can get somewhat decent data on the stock market going all the way back to 1871. Back then, your great-great-great grandmother was getting The Stocky Fox as a newsletter delivered by the Pony Express. Going that far back, you can calculate the percentage of the time that you would have lost money investing, historically.
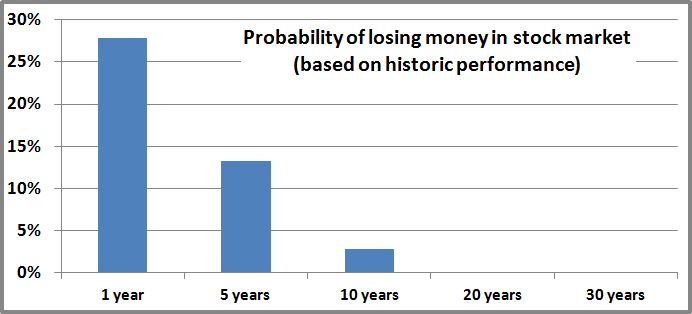
So imagine starting in January 1871 and investing $10 every month in the US stock market. By January 1872, you would have invested a total of $120 and your stocks would be worth $128; congratulations, you just made a profit. You can do that for every 12-month period since 1871 (there are about 1700 such periods), and you come out ahead 71% of the time, which seems pretty good. But the flip side is that you’d have lost money 29% of the time, and at least to me that is too high to be really comfortable.
However, remember that when investing stocks, time is on your side. Do the same exercise but for five years; if you started in January 1871 after 5 years you would have invested a total of $600 which would be worth $679 in January 1876 (yeah, profit again!!!). Do that for every five-year time period and you end up losing money only 13% of the time. By adding another four years to your investing time horizon that decreased the chances that you would have lost money by 20%!!! That seems pretty amazing.
You can keep doing that for longer time periods, and as you could guess, the percentage of times you would have lost money keeps going down. Astoundingly at the 20-year mark, you would have lost money only one time out of the nearly 1500 periods possible (the one month was June 1912 which, you guessed it, was 20 years before the Great Depression bottomed out). At 30 years, there isn’t a single time period where consistent investing would have lost money!!! That’s not a misprint. Read that paragraph again.
There are no guarantees, but if you use history as a guide, it’s pretty much a sure thing that you’ll make money in the stock market. Certainly it involves a lot of discipline, investing month after month no matter how bad things look (dollar cost averaging). Also, it doesn’t necessarily mean you always make a lot of money, but the data seem pretty powerful. Additionally, I didn’t take inflation into account so that would definitely skew the numbers downward (but you know how I feel about the integrity of the data on inflation, so there you go), but the message remains largely unchanged.
I must confess that I was a bit surprised by the data. Actually, I spent about 30 minutes going through the spreadsheet to see if I made any mistakes; I’m pretty confident the analysis is sound. As Dr Brown asked Marty in Back to the Future, “Do you know what this means?” (just don’t take what he says after that and apply it to my analysis). If your time horizon is 20 years or more, at least based on history, there’s virtually no chance that you’ll lose money. I figured it would be a pretty low chance, but zero chance? I didn’t see that coming. Even people who invested for 20 years then pulled out after the Great Recession in 2008 did fairly well (invested $240 which became worth $339).
So there you go. My answer to the question posed at the top is still: No one knows what the future holds. But the historic data confirms my personal belief that the stock market is a really great place to invest your money. I lose no sleep worrying about the Fox family’s investments increasing in value. I know over the long term they will.
Last year about this time, the nation was gripped in Bitcoin-mania. It was dizzying.
As with most bubbles, it transcended financial markets and wormed its way into the mainstream. Everyone was talking about it, from late-night talk show hosts to grandmothers and everyone in between.
I wrote my thoughts on the matter here. Just after that post, Bitcoin rose another 10% and then cratered precipitously. I predicted its decline would result from it being connected to a terrorist attack and world governments using that as a pretext to extinguish it. As it happened, it just seems that the bloom fell off Bitcoin’s rose. Sometimes financial markets are fickle.
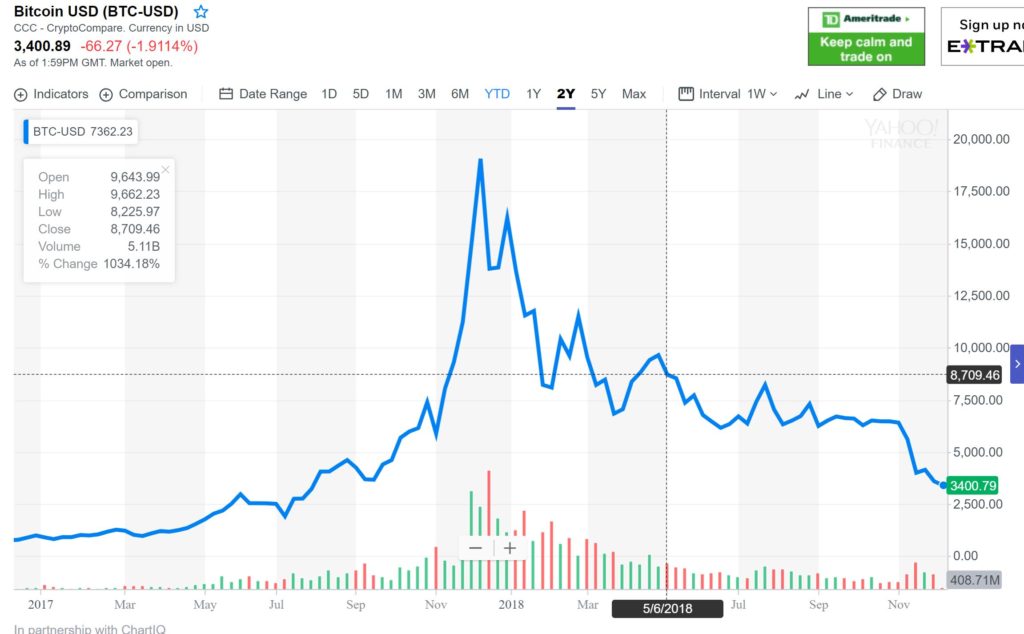
In 2017 Bitcoin rose from about $1000 to a peak of almost $20,000. As fast as the rise was, the fall has been nearly as fast; from $20,000 to about $4000 today. But this post isn’t a victory lap—Bitcoin bears were clearly proven right, so what’s the point of adding on there?
The point of this post is to give a little bit of love to Bitcoin. I wouldn’t say I’m making a bullish bet on Bitcoin (I certainly haven’t bought any, and have no plans to). However, here is an argument why it may not be doomed.
You can actually buy
stuff
The biggest problem for Bitcoin was that it had no intrinsic value. That’s not a deal-breaker: fiat currencies (dollars, euros, yuan, etc.) are only valuable because their home countries say they are and pass laws that you can use those pieces of paper to pay for stuff (more on this in a second).
Without that government backing, Bitcoin becomes a bit like gold or diamonds, inherently worthless pieces of stuff but are valuable because enough people in the world think they are valuable. Of course, a big difference is that you can hold gold or a diamond, but not so much with Bitcoin.
In December 2017 enough people thought Bitcoin had value that it pushed the price to $19,000. Today, many fewer think it is valuable so it’s worth much less, hence the $3400 price.
Through it all, Bitcoin was missing a major component of a currency (like a dollar) or even a store-of-value commodity (like gold)—you couldn’t buy anything with it. I don’t think you would have had near the crash (and probably not the run-up either).
Until recently, you could only buy stuff with Bitcoin on the fringes of the economy. Certainly, the black market accepted it, but that’s not exactly what we’re going for. A very small handful of regular stores(virtual or brick-and-mortar) did, but that was minuscule.
That may be about to change in a profound way. The state of Ohio recently announced that you can pay your taxes using Bitcoin. It’s hard to understate the importance of this. Paying taxes, by definition, is about as legitimate a transaction as there is. All the sudden Bitcoin is a legitimate currency, at least to the state of Ohio. To compound the point, I don’t believe you can pay your taxes in Ohio in euros or yuan (undeniably currencies)or gold or diamonds (undeniably stores of value).
How will this impact
Bitcoin’s price
Now that Ohio will accept it, that will create a real market for Bitcoin. That begs the question,what will that do to the price? You should expect my normal answer: I have no idea. But I do have some thoughts.
Bitcoin’s price has been in freefall for months now. This was caused in large part by the tiny, tiny issue of Bitcoin not being used anywhere. Now that has changed. I still think Bitcoin could go down, but I definitely think it will not go down as much as it would have if Ohio hadn’t made it’s decision. It’s impossible to know if I’m right or wrong on that, since we can’t test things in alternate dimensions.
It’s not to say Ohio is getting in the Bitcoin game. It just takes the Bitcoin payments, sends them to a market to get exchanged into dollars, and they have their money.
Ohio has taken the first step and it’ll be interesting to see if any other states follow suit. If a large state like New York, Texas, or California also starts accepting Bitcoin, I think that will definitely buoy it’s value as it becomes even more of an accepted currency. And of course the coup d’etat would be the Federal government accepting it.
Overall, I still think Bitcoin will be volatile, probably to the downside. However, I do think maybe we’ll back in five years when Bitcoin has settled to something of value,probably less than $4000, and look at this Ohio decision as the first step towards that stabilization.