Going all in with stocks

buried-money

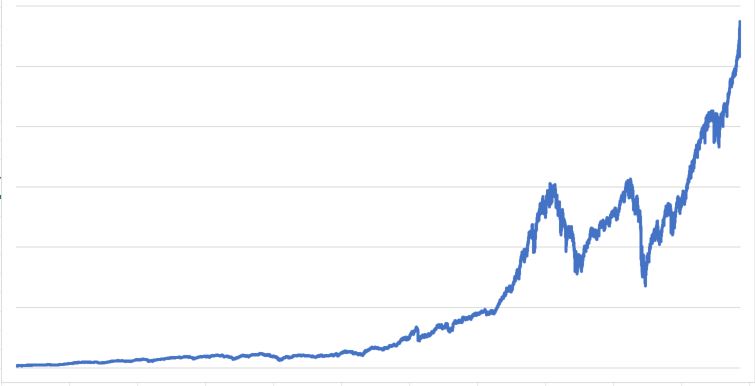
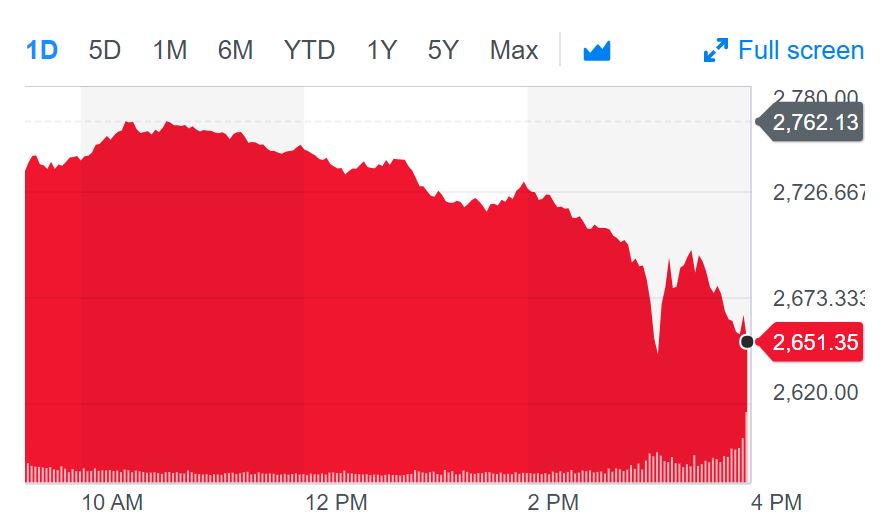
With the recent craziness in the stock market, I’ve chatted with friends about how much of their portfolio should be in stocks.  Actually the conversation goes more like:

THEM:  I am about 50% stocks, 50% bonds.  How does that sound?

ME:  50% stocks and you’re 41 years old, and you have a good job?!?!?!?  Are you crazy?  That’s way too conservative.

THEM:  But I don’t want to be too risky.

ME:  You have a lot of safe investments that you probably don’t even know about.  The investments you can invest in stocks you should so you can get the higher return over the long term.

THEM:  ??????


So here is what I am talking about–the hidden cash in your portfolio.

We know that you need to balance risk and return in our investments.  This is most clearly done when we choose our mix of stocks (more risky, higher average returns) and bonds (less risky, lower average returns).  As an investor gets older they want to shift their asset allocation towards less risky investments because their time horizon is shortening.  We all agree with this.  So where is this hidden pot of gold I’m talking about?


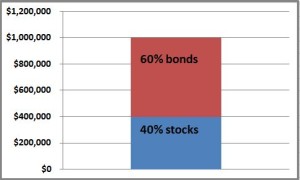
Let’s look at the example of Mr and Mrs Grizzly.  They are both 65 years old and entering retirement.  They worked hard over the years and socked away $1 million that will see them through their golden years.  They do some internet research and learn that a sensible asset allocation in retirement is 40% stocks and 60% bonds, so they invest $400k in stocks and $600k in bonds.  Knowing the long term average returns are 8% for stocks and 4% for bonds, they expect their $1 million nest egg to generate about $56,000 per year ($400k * 8% + $600k *4%) , knowing that some years it will be more and some years it will be less.   So far so good, right?

1 m

THEY ARE LEAVING MAYBE $20,000 PER YEAR ON THE TABLE.  That’s a ton of money.  How can this be?  They seem to be doing everything right.  The answer is they are being way too conservative with their asset allocation.  They shouldn’t be investing $600k in bonds and $400 in stocks; stocks should be a much higher percentage.

Waaaaiiiiiiiittttttttt!!!  But didn’t we agree that about 60% of their portfolio should be in less risky investments?  Yes, we did.  Are you confused yet?


Hidden cash

Here’s what I didn’t tell you.  Mr and Mrs Grizzly have other investments that act a lot like bonds that aren’t included in that $1 million.  Both Mr Grizzly and Mrs Grizzly are eligible for Social Security with their monthly payments being $2000 each.  If Mr Grizzly (age 65) went to a company like Fidelity and bought an annuity that paid him $2000 each month until he died (doesn’t that sound a lot like Social Security), that would cost about $450k.  So in a way, Mr Grizzly’s Social Security payments are acting like a $450k government bond (theoretically it would be worth more than $450k since the US government has a better credit rating than Fidelity).  And remember that Mrs Grizzly is getting similar payments, so as a couple they have about $900k worth of “bond-ish” investments.

Also, Mr and Mrs Grizzly own their home that they could probably sell for $300k.  They don’t plan on selling but if they ever needed to they could tap the equity in their home either by selling it or doing a reverse mortgage.  So in a way, their house is another savings account for $300k.

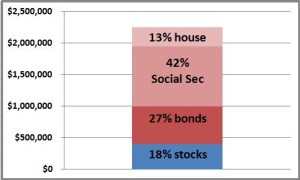
If you add that up, all the sudden the picture looks really different.  They have about $950k of Social Security benefits that have the safety of a government bond.  Plus they have that $300k equity in their house.  That’s $1.25 million right there.


Investing your portfolio

So now let’s bring this bad boy full circle.  Remember their $1 million nest egg they were looking to invest?  Look at that in the context of their Social Security and house.  Now their total “assets” are about $2.25 million.  If you believe that the Social Security and house kind of feel like a bond, just those by themselves account for 55% of their portfolio.  If on top of that if you invest 60% of their $1 million nest egg in bonds, they have over 80% of their money in bonds, and that seems way too high.

2 25 m a

On the other hand, let’s say they only put $100k of their nest egg into bonds and the rest into stocks, after you include their social security and home, they’d be at about 60% bonds and 40% stocks.  Isn’t that what they were aiming for the whole time?

2 25 m b

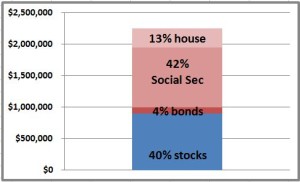
Wow.  It took a long time to get there, Stocky.  The punchline better be worth it.  Remember that with $600k in bonds and $400k in stocks, they had an expected return of about $56,000 per year.  However, if they have $100k in bonds and $900k in stocks, because stocks are more volatile but have a higher expected return, they can expect about $76,000 ($900k * 8% + $100k *4%).  THAT’S $20,000!!! 

But aren’t they taking on a lot more risk to get that extra $20k?  Remember, there’s no such thing as a free lunch.  For sure, but if you look at it in the context of their Social Security benefits and their home, they have a fair amount of cushion from “safe investments” to see them through any rough patches in the stock market.


I wrote this post to show that people really need to take account all the financial resources they have.  In the Grizzly’s case, it was their Social Security benefits and their home.  Others of you may be getting a pension (Medtronic is generous enough to offer the Fox family one) or a second home or a dozen other things like that.

When you take those cash flows into account, all the sudden it seems a lot more reasonable to invest the rest of your money a little more heavily in stocks which you know over the long haul will give you a better return.

Market dips are awesome?!?!

Holy crap!!!  The last week of the market has been insane.  We’ve seen the largest point drops in the history of the Dow—1175 drop on Monday and 1033 drop on Thursday, although neither ranked within the worst 50 drops in percentage terms.  This is crazy, yet why would I possibly think that this is a good thing?  Over the past 6 trading days, the market is down about 7%.  Yowza!!!

I am, and most of you are, long term investors.  The money I am investing in the stock market is meant to be spent years, or more likely decades, from now.  Sure, what happened right now sucks and maybe is scary (although I think it’s actually the opposite).  That should be comforting because, although we’ve taken a huge body blow, the good news is that we have a really long time to recover.


Dollar cost averaging

OK, that might explain why it’s not so bad, but how could it possibly be good?  If you can take a Pepto and keep your head, this is actually a great time to be investing, be it regular contributions to your 401k and IRA or just regular stock purchases.  If you were excited to buy stocks two weeks ago when the market was frothing, you should be even more so now that stocks are “on sale” at 7% off.

Sure, that might make sense philosophically, but how does that work in real life.  Let’s look at my nephews Risky Fox and Safey Fox.  Risky Fox invests $10 every day no matter what happens.  His twin Safey Fox cut a deal with the investing gods where every day the stock market goes up an equal amount.  Both twins started investing on January 1, 2000, and each has invested $10 every day for those 18 years.  They both start when the S&P 500 was at 1455 at the start of the millennium and they both end last Friday when the market was at 2,620.

Those 18 years have had crazy bull markets and crazy crashes—the dot-com bubble and it’s popping in 2001, the Great Recession of 2008, and the Trump run of 2017.  Those are the big ones but there have been mini-crashes and corrections too like August 2011 and January 2016.

Through all of that Risky invested $10 through thick and thin, no matter where the market was, high or low.  In her bizzaro alternative universe, Safey invested $10 every day , knowing each day the market went up a small but consistent amount (0.0129% each day if you’re curious).

Who ends up ahead?  It would be a pretty stupid column if it was Safey . . . of course it was Risky Fox.  Each invested $45,560 over those 18 years.  Safey ends up with $62,011 which isn’t bad.  But Risky ends up with $89,773, about 45% more.

How does such a thing happen?  In 2001 the dot-com bubble popped and stocks fell 45% over three years.  Throughout all that Risky kept plugging away, investing his $10 each day, but now he was getting stocks at a huge discount.  Stocks recovered after a few years and that looked like a great buying opportunity in hindsight.  Then in 2008 the Great Recession his and stocks fell about 55% in a little over one year.  Again, Stocky keeps investing and when stocks bounce back, he looks like a genius for having kept faith and picking up stocks at a substantial discount the whole time.

And just to prove it isn’t a unique thing, if you did the same Risky/Safey experiment for the 1970s, 1980s, and 1990s, you get similar results.  The 1960s and 1950s have Safey coming out ahead, but by a much smaller amount.


Risky

Safey

Difference

2000 to 2018

$89,733

$62,011

45%

1990s

$69,324

$56,044

24%

1980s

$51,181

$48,492

6%

1970s

$28,650

$27,538

4%

1960s

$29,951

$31,100

-4%

1950s

$48,480

$50,926

-5%


And never lose sight of the fact that what Safey is doing is impossible.  The market doesn’t work like this.  This just shows that what Risky is doing, something we all “have” to do, really isn’t all that bad.

It’s similar to asking if you can get from point A to point B faster by walking with your feet or flying with your wings.  You can get there with your feet most of the time more quickly, but even if that wasn’t so, none of us have wings.  The whole point is that buying through market down turns (or walking with your feet) does pretty well, even when compared to some fantasy construct.


Faith

Ultimately, this is a lesson of faith.  When we were in the depths of the Great Recession, Warren Buffet famously professed his faith in the US economy.  He turned out to be right and made tens billions (billions with a “B”) along the way.

There’s no proof that markets will always go up (predicting the future of human behavior is always impossible), and at the end of the day it’s a matter of faith.  If you believe in capitalism then you believe that stocks will always go up.  I do believe in capitalism so I do believe that stocks will always go up.

That’s what makes the little experiment with Risky and Safey work.  Even when things look horrible, like it did in the dot-com bust and the Great Recession, if you have faith in capitalism you’ll look at the downturn as a temporary turn that will ultimately return to rising prices.  You can see this by looking at a long term stock chart of US stocks: they have an unrelenting upward march through all sorts of markets over 100 years.  Or you can look at the data that shows that historically consistently investing in stocks has never lost money over a 20-year horizon.

S&P 500 since 1950

That brings us full circle.  We’ve been bashed in the face the past 6 trading days.  Stuff like this happens.  I have total faith in capitalism which means I have total faith that things will recover.

When people have asked me what I think will happen/what I think they should do, I tell them to keep on keeping on.  Keep investing in your 401k, keep putting away money in the 529 and your IRA.  It’s probably a lousy time to withdraw a ton of money for a beach house or some other massive expenditure, but beyond that, what’s going on in the stock market really shouldn’t be impacting you at all.

BOOM—Top 5 impressions of Dow’s 1150 free fall

Yowza.  Yesterday was a crazy day.  There’s an ancient Chinese saying: “you are lucky to live in interesting times.”  Definitely the past couple days the stock market has been interesting.

Yesterday I got cocky and wrote a post on the 666 point fall on Friday.  I was a bit aloof, and the investing gods love nothing more than to humble people like that.  So in a weird way, I take some of the responsibility for the 1175 point drop yesterday.

Seriously though, let’s take a look at what’s going on.  Here are my Top 5 impressions of what happened, and what it all means.


  1. Biggest point drop in a day

Yesterday’s 1175 point drop for the Dow was the largest of all time.  Living in interesting times, right?  But at a 4.1% decrease (I’m going to be using S&P 500 for percentages just because it’s a broader market and the data is easier to get), yesterday was about the 30th biggest drop since 1950.

A top 30 (or bottom 30 depending on how you want to look at it) is notable given there have been over 17,000 trading days since 1950.  However, top 30 means that on average, something like this happens about every other year or so.  Maybe not so special.

Remember the last time we had a drop this big?  Of course you don’t.  In August of 2011 there was a -4.5%.  Actually, August 2011 was a crazy month—there were FOUR days with percentage drops greater than the one we had yesterday.  Think about that for a second.  The month of August 2011 was a major rollercoaster with a lot of ups and downs.  Stocks were down 5.7% for the month.  But we don’t remember that at all because it was just a blip.  Just.  A.  Blip.

That’s how I think we’ll remember this one.  There are never guarantees, but this stuff happens all the time in investing during your 60+ year investing career.  Get used to it.


  1. See the horrors of automated trading

Look closely at the daily chart right around 3pm.  It took a super-steep nosedive, at that point falling to about 1500 points.  But then, nearly as quickly it recovered about 500 points.  That a huge swing in about 10 minutes.

What caused that: Automated trading.  Computers saw all the selling around them and were programmed to sell too.  However, what should be very comforting is that humans (and other computers with different programming) saw that and realized that the selling was overdone.  They stepped in and started buying.

Computer algorithms are a newer phenomenon in the market.  I did a post of how they lead to much more volatility (written the last time the market went really crazy).  However, while volatility may rise, it really doesn’t have any long-term impact on returns.

But the lesson here is realizing that a lot of what goes on is driven by thoughtless, emotionless computers that don’t really realize if there is an “overreaction”.  As a human who has perspective, that means you can keep your cool when that stupid machine thinks it’s all going to hell.


  1. How bad are things really?

This is important.  What has fundamentally changed since a week ago when stocks were at an all-time high?

Really not much.  There was a jobs report that showed wages had crept up a bit.  On top of that Janet Yellen has stepped down as Chairwoman of the Federal Reserve, and is being replaced by Jerome Powell.   Yellen was seen as fairly dovish on inflation, tending to keep rates lower for longer to spur higher employment.  Powell is a bit more hawkish and is seen as more likely to raise rates more quickly to fight inflation.  That goes to the whole thing we were talking about with the Fed yesterday.

Beyond that, which I think is a bit of a Red Herring, there aren’t any fundamental economic problems that are causing this.  In 2008 the mortgage crises exposed the rotten foundation of the banking industry; in 2001 the internet bubble popped and exposed massive accounting frauds; in the 1970s OPEC exercised considerable cartel power (something that I wrote about here as unlikely to occur again).

That’s a quick rundown of all the major stock market disasters of the past 60 years.  I don’t think there are any fundamental issues like that which we are uncovering to cause that to happen now.  Rather, while we remember those three listed above, just like August 2011 there are a dozen mini-disasters that turned out to be much bigger bark than bite.  I think that’s what we’ll have here.


  1. What I think is going to happen

Making predictions on the stock market is a sure way to look stupid, but I’ll do it anyway.

I think we’re definitely in for a wild month.  I bet today (Tuesday 6-Feb-2018) the market will be up 200 points, then down 300 and another 500 the next two days.  We’ll have a ton of volatility for the rest of the month, and we’ll end February down 4.8%.  For the year, I will stick with my prediction from December 2017, and I think we’ll be up 5%.

What am I basing that on?  A lot of gut, and that’s never a good thing.  The market has had an unprecedented run.  These things can’t last forever, and the market does take “breathers” (sometimes called corrections).  I think that’s what we’re going through right now.

However, the fundamentals are strong.  The tax break is a big boon.  Even more important, the tax break and a lot of other things are spurring innovation.  Money is being deployed in R&D instead of sitting in banks in Ireland and Switzerland.

Being as involved as I am in the medical device space, I know tremendous innovation is happening.  Diabetes is on the brink of being cured by Medtronic; bear in mind in the US we spend about $250 billion (read that again, a quarter TRILLION) to treat that.  Think of all the benefits that will follow.  Also we’re on the brink of having driverless cars which that alone will create well over a trillion dollars in sales and societal benefit.  Those are just two of probably a dozen you could rattle off.  Bottom line, I think things are really good right now.


  1. How this should impact your portfolio

It shouldn’t.  Definitely this shouldn’t scare you off into selling your portfolio.  There’s a famous saying in the stock market that says “You should be scared when others are greedy, and you should be greedy when others are scared.”

A week ago stocks were flying high and everyone was greedy.  As it turns out we should have been scared, but hindsight is 20/20.  Now that everyone is scared, we should be greedy.

That said, I wouldn’t try to time the market either.  A friend, Mr Snow Leopard, has a bit of cash sitting on the sideline and we were chatting about this and what to do.  I said if it was me, I would invest in equal installments over the next three or so months.  I know that goes against my analysis on how to invest a windfall, but I think things are so crazy right now, I wouldn’t feel comfortable putting all the chips in on one hand.  I’m going with my heart over my head, but oh well.

I think we’ll definitely be in for a rocky ride and I think there are going to be a few of these really good buying opportunities interspersed with glimpses of optimism.  Either way, DEFINITELY DON’T PANIC AND SELL OUT.

Fed rate hike spooks Wall Street

Last Friday there was blood flowing down Wall Street.  The Dow suffered its 6th largest point drop in a single day, falling 666 points (que Iron Maiden).  Being a top 10 worst day seems like it’s important, but that really overstates things.  The Dow is so high now, at 26,000, that a 700-odd point drop really isn’t that big.

If you look at the list of the Top 20 biggest point drops, this one ranks at #6.  But in percentage terms it’s lowest on that list.  In fact, since 1950 there have been about 200 or so drops in percentage terms this bad.  That comes to about 2-3 per year.  So let’s not get too freaked out.

Also, let’s keep in mind that the stocks are up 3% so far for the year.  That’s really good, and no one would normally complain about that after just a month.  But it’s human nature to complain, so that’s what we do.

OK, I’m a little calmer.  But it’s still worth trying to figure out why the drop happened.  Most economists look to the Federal Reserve as the culprit.  Or more precisely the idea that inflation is steadily rising and that will prompt the Fed to start raising interest rates.  You know my feelings on inflation in general, and specifically I predicted a few weeks back that over the long term we would have really low interest rates.  Either way, new ideas on inflation weren’t what spooked the market, but the idea that the Fed would start raising interest rates.

That begs the question, how do interest rates impact the market?  And that’s really French for Why is the Fed so important.


How does the Fed impact the economy?

Let’s imagine a really simple economy.  There are ten companies named A and B and C all the way down to J.  Just like in real-life, not all companies are created equal, with some being much more profitable than others.  Here A is the most profitable (maybe like Apple) while J is the least profitable (maybe like JC Penney).

Interest rates will play a big part in the profitability of these firms.  As interest rates go up, the amount they spend on interest for all their debt goes up as well.  Because A is so profitable, it would only start to lose money if interest rates went really high, up over 10%; however J is much more vulnerable and will become unprofitable if interest rates go over 1%.  All the other companies have a similar situation as shown in the graph.

So this is where the Fed comes in.  Let’s say the Fed sets the interest rate at 6%.  Firms A, B, C, D, and E are all profitable even when the interest rates are that high; but firms F, G, H, I, and J are not.  Because of that things won’t look good for firms F-J.  Maybe it’ll be so bad that they’ll go bankrupt or maybe they’ll lay off people or put a hiring freeze on.

At 6% interest, you have five firms that are doing well (A-E)—growing, hiring more people, expanding, etc.—and five that aren’t (F-J).  And at 6% the economy is performing at a certain level.  But what would happen if the Fed lowered the interest rate from 6% down to 5%?  One more firm (F) would be profitable, and in general it would benefit all the firms.  The profitable ones would be doing even better, and the unprofitable ones wouldn’t be quite so bad off.  And that would lead to a strong economy: more “stuff” would be produced and more people would be employed.

So there is very clear relationship that lower interest rates led to a stronger economy.  Having a strong economy is one of the Fed’s goals, so that begs the question, “Why doesn’t the Fed push rates all the way down to 0%?”

This is where it starts to get interesting.  It’s my favorite topic: Inflation.  Remember that the Fed’s first job is to control inflation.  Let’s look at the Fed’s decision to move interest rates from 6% to 5%, but now look at it with an eye towards inflation.

In our pretend world, let’s assume at 6% interest rates the economy is doing well.  Things are growing and unemployment is fairly low.  When interest rates go to 5%, firm F will become profitable so they’ll want to hire some people—makes sense.  But remember that unemployment is low, so F is going to need to tempt people who are already working for A or B or C or whoever to come work at F.  How does F do that?  They pay them more.

F starts to pay people more, but A doesn’t take this lying down, so A starts paying more.  This wage increase trickles through the economy.  But A and B and even F need to make money, so the increase in compensation they’re paying to their employees gets passed along to consumers in the form of higher prices.  When prices start rising, that’s INFLATION.  And controlling inflation is the Fed’s #1 goal.  So that creates the difficult balance for the Fed—they want the economy to do well but not so well that it triggers inflation.

So there you go.  You just completed a course in “Introductory Macroeconomics”.


What’s going on today?

Now that you have that little lesson under your belt, how does that relate to what’s going on with the Fed right now?  Currently, the Fed has interest rates at about 1.5%.  That’s really low, but actually over the past couple years the Fed has been raising interest rates from when it was at 0%.  Obviously that’s super low, so shouldn’t the Fed be worried about inflation?

Remember the circumstances of how interest rates got that low.  At the beginning of 2008 the economy was going strong and the interest rate was at over 5%.  But then the financial crisis hit, blowing up the banking industry, and sending the world economy into a very sharp recession.  A ton of people lost their jobs (unemployment went up) so prices stayed flat or even started to fall a little bit.

With all this going on, the Fed threw a life raft to the economy in the form of near 0% interest rates.  In the intervening years, the economy has rebounded and unemployment has fallen, but inflation has remained pleasantly low.  This is kind of the best of both worlds for the Fed—the economy is strong and there’s no inflation.  The two things they have to balance are both in happyland, so they have kept interest rates low.

But what keeps them in the news is “the specter of inflation on the horizon.”  If you follow this stuff (like I do) in the past few months, every time inflation numbers come out, everyone looks at those and tries to predict what the Fed will do.

Every time this happens the market swings like a pendulum.  If rates are going to go up, the stock market gets crushed because firms will be less profitable (as we saw on Friday and in the little illustration above).  If that changes and we think rates are going to stay low, the market shoots up like a rocket.


What does it really mean when the Fed changes interest rates?

With all of this, are we just a bunch of idiots?  Should we really be so happy if the Fed is keeping rates low, and should we be so bummed if the Fed raises rates?

As the parent of two boys who one day may start sponging off Foxy Lady and me, I think the parent-child relationship is a good analogy.

Imagine you have parents (the Fed) who have a grown child (the US economy).  Times are tough for the child (the economy is doing poorly) so the parents help out (the Fed lowers interest rates).  The good scenario is that the child starts doing better to the point where he doesn’t need his parents’ help (the economy strengthens so it can withstand higher interest rates).  The bad scenario is the child becomes dependent on his parents’ help and is never able to make it on his own.

In this analogy the parents reducing the amount of help they give (the Fed raising rates) is a good thing, isn’t it?  It means that the kid is getting things on track and is standing on his two feet.  For this reason, I actually think it’s a good thing if the Fed raises interest rates because it means that the economy is strong enough that it doesn’t need insanely low interest rates any more.  Yet the markets react in the exact opposite direction.

I get it.  Just as the kid would be bummed if the parents said, “Hey pal, since you’re starting to make some money now, we won’t be sending those monthly checks”, the companies are bummed that they can’t borrow money so cheaply.  But that isn’t sustainable.

I chalk this up to yet another of a million examples of how the stock market acts in a goofy manner in the short term.  And another reason why I NEVER try to time the market.  I just keep my head down and invest for the long term, regardless of what is going on with interest rates.  But watching everyone hang on the Fed’s every last word does make for perverse entertainment.

Shopping for health insurance (part 1)

I’m trying to build my audience, so if you like this post, please share it on social media using the buttons right above.

The Fox family had to shop for health insurance on the open market recently.  It was quite an eye-opening experience.  Given what a sensitive issue health insurance has become, I think our experience definitely offers insights into how screwed up the healthcare landscape is, but also how reasonable health insurance is.  This “reasonable” -ness actually has the potential to be a huge gold mine that it alone could fund your entire retirement.

Here is our story—this is an epic post so I’ll be cutting it into two (or dare I say three) sections.  Here’s part 1.

Up to this point

Until recently, I lived my entire adult life being covered by corporate health insurance (and I think that’s part of the problem—more on this in a second).  At age 21 I started with Medtronic and was covered with their employee health plan.  All the way through 2015, since I always had a corporate job, I was always covered by my employer’s health insurance.  Once the cubs came around, they were covered by my employer’s plan as well.

After I left Medtronic and retired, our family was covered on Foxy Lady’s employer plan.  So really nothing changed except we went from one corporate plan to a different one.

In 2017 when Foxy was laid off from her job we had to get a little creative.  I was doing consulting, and I cut a deal with one client—take some of what I was charging them, and make me an employee and give me health insurance.  That worked for a year, so again we were covered under a corporate plan.

Then in December we got a call from that client that they were changing their benefits and I couldn’t get health insurance from them any longer.  All good things must come to an end.  So we had to look for health insurance like one of the millions of families who don’t get it through their employer.


Obamacare is no bueno

Fortunately, when we got the call from my consulting client saying our health insurance was ending, it was in early December.  The deadline to enroll in Obamacare was December 15.

I admit, the idea of finding health insurance on my own was a bit daunting.  It was something I had never done before, and given all the media coverage it gets about how awful it was, I was a bit intimidated.

I didn’t really know where to start the search.  Of course, I knew about Obamacare (in this day and age, how could you not?), so that’s where I started.  After I entered in all our information in the online form, I saw we could get a policy with a premium of about $2,300 per month.  Depending on our income, we could get a subsidy that would push that down to about $500 per month.  A subsidy could be in play given our income is very “feast or famine”, but realistically we were going to pay full price.

Our coverage would cost about $2,300 per month.  That’s a bitter pill, but if that’s what it is, that’s what it is.  However, the bad news didn’t stop there.  Obamacare had really high deductibles and out-of-pocket.  The maximum out-of-pocket for a family was about $15,000 for the family.

It’s complex and there are a ton of nuisances, but basically if the disaster situation struck and we had a ton of medical bills, we would be on the hook for all our monthly premiums (about $28k for the year) plus the out-of-pocket (about $15k).  After that first $43k we’d be good (that’s meant to be very sarcastic).

After going through all this Foxy Lady and I looked at each other with defeated countenances.  No wonder why most families can’t afford health insurance.  We were staring down the barrel of a $45k shotgun.  We’re pretty wealthy thanks to good jobs and smart investing, but even for us this would take a painful chunk of our nest egg.  Best case we’d pay $28k in premiums and worst case we’d pay $45k.

Who really knows what health insurance actually costs?

You can imagine after seeing those numbers for Obamacare, we weren’t in a good place.  But how was it possible that it was that bad?

I’d lived my whole life with health insurance, including my whole adult life where I was paying for it myself.  It was never this bad . . . or was it?

Actually, I’m not sure I ever really knew what I was paying for health insurance, and sadly I think this is fairly common.  When I was with Medtronic, I got paid every two weeks.  As with most of us, there were a ton of deductions in my paycheck that whittled down what actually went into my checking account compared to what Medtronic was shelling out.  We all know the culprits: taxes, 401k, flex spending, and of course health insurance.

Psychologically, I think when something is automatically deducted from your paycheck, you don’t really think about it or appreciate how much it costs (and that’s a major problem).  Every two weeks I was paying about $500 for our family’s health insurance.  That comes to about $1100 per month, and that actually seems like a lot of money . . .

. . . But it didn’t stop there.  Typically, what gets deducted from our paychecks only covers a fraction of the real health insurance cost.  As an employee benefit, many companies pay the other part.  That makes it really hard to figure out how much your health insurance costs.

Every year Medtronic would send out a sheet to each employee outlining all the wonderful things they did for us, and they included the cost they paid for my health insurance.  As it turned out, they paid about 50% of the total cost.  All in, the monthly cost for our health insurance was about $2,300, surprisingly close to the Obamacare costs.

How many people realize what they’re paying for health insurance?  Probably not many.  How many people realize what their employer is paying?  Probably even less.

At the end of the day, we live in a country where most people are paying for health insurance one way or another, and almost no one knows how much it costs.  That’s a real problem, a real problem for an entire society that is trying to figure out how to pay for health care.

Wow!!!  We’re already at over 1,000 words and we’ve barely scratched the surface.  We’re totally doing this in three parts.  Tune in tomorrow to see my take on how health insurance works, and then Thursday to see what we did and how we’ll actually save a ton of money (about $5 million over our lifetime) by doing health insurance in the open market.

Jan 2018 has been sizzling . . .

. . . and it shows you can’t outsmart the market.

It’s been a mere three weeks into the new year, and stocks are way, way up: US stocks are up over 5%, and international stocks are up nearly 6%.  IN THREE WEEKS!!!  That’s crazy . . . crazy awesome.

As you sit back and count all the money you’re making in the market, let’s put January 2018 into perspective.


How special is this?

5% in a month (and we aren’t done yet) is good, but not too special.  Since the S&P 500 began in 1950, there have been 90 months at least as good as this January has been.  That’s about 11% of the time, so a little more than once per year on average.  So that’s not too special . . .

. . . But this one is coming off the heels of some really strong performance.  In the past, most months at had at least a 5% return were rebounding from the previous month which wasn’t that good.  So for example, in September of 2015 that month had a 6.6% return but the month before the market was down.  Same thing in October 2015, October 2011, December 2010, September 2010, and July 2010 (those are the most recent 6 instances).

It might make sense for a really good month if it was sling-shotting off a really bad month, like those most recent examples.  Yet, that’s definitely not what we’ve seen.

January is actually the 10th month in a row that the S&P 500 has been up.  Since 1950 there have been two other streaks like that, in 1954 and 1958 (both of which were 11-month streaks).  So we’re in one of the longest, sustained market runs of all time, and we just busted out a 5.1% month.  That’s a bit like running a marathon and in the 22nd mile kicking out a 4:00 minute-pace.

No matter how you cut this, the market for the past year has been really special.  We’ll be telling our grandchildren about this.


You can’t outsmart things

The market is a benevolent teacher.  Actually, maybe not benevolent (some of the market’s lessons can be quite harsh), but certainly a teacher.  There’s a valuable lesson here.

Go back in time three weeks ago.  We were all enjoying football games on New Year’s Day, making resolutions we probably won’t keep, and taking stock (pun intended) of how our investments went in 2017 and what we can expect in 2018.

There was every reason to think 2018 might be a bad year for stocks.  Stocks had just been on an incredible run, so it wasn’t unreasonable to predict a bit of a correction.

Of course, there are a million ways you could go, but there are a ton of really reasonable arguments you could make for why the market might not do so well in 2018.  Yet, so far in January it has busted out a huge month, and if you are fully invested you have made a ton of money.

On the other hand, if you tried to outsmart things and time a market decline, you missed out on a really great month, and that has costed you hundreds or thousands or hundreds of thousands of dollars.

The point of all this is, and I certainly eat my own cooking on this, that you can’t predict the market.  You can spend countless hours trying to figure it out, but it’s unfigured-outable.  The best thing you can do it invest your money and keep it in the market until you need it.


That said, I hope you have been fully invested and those numbers on your spreadsheet have been going up and up.


Inflation Killers—Credit Card Rebates

NOTE: If after reading this, you would like to apply for one of the credit cards that the Fox family uses to max out credit card rebates, we can send you a link and that lines our pockets with a bit of money at no additional cost to you.  Let me know if you’d like to do that.

We’ve talked about how your cell phones are a great killer of inflation, along with other things store brand groceries and Craig’s List and the sharing economy.  But there’s another product that is totally killing inflation that makes those seem like small potatoes—your credit card and the rebates you can now get.

Back in the day credit cards allowed a convenient way to purchase products without having to carry around a lot of cash.  Eventually competition among credit card companies began to heat up, and by the late 1990s they started offering rebates to card holders on their purchases.

Let’s take a quick look at how credit card companies make money:

  1. They charge interest and fees to those who carry a balance. This is where there is a ton of money to be made.  For the purposes of this post, we’ll ignore this other than saying the Fox family never carries a credit card balance.
  2. They take a cut of all purchases. When you buy something for $10 at the store with your credit card, you end up paying $10.00 for it, but the store only gets about $9.41.  That’s because the credit card processing company charges 2.9% of the purchase plus $0.30 on each transaction.  Most people don’t think about this revenue stream, but it definitely adds up.


So obviously to maximize revenue from #2, credit card companies want as many people buying as much stuff as possible on their credit cards.  That leads to competition from the likes of Chase and Capital One and a ton of others, and that competition has taken the form of credit card rebates that over the last 20 years have gotten more and more generous.  Credit card companies are enticing you into using their products by giving you a cut of #2.

My first credit card was a Visa associated with Exxon.  It offered a rebate that could be redeemed for free gas.  It was something like 0.5% of my purchases, but it was better than nothing.  I was already buying gas so once a month I would get something like $12 off a fill-up.  Over the course of a year that added up to maybe $150, not a ton of money but free money nonetheless.  Given that I wasn’t getting that before, that was definitely “deflation” on my gas purchases—SCORE.  Compared to what is offered today, that was just a pittance.


Credit card arms race

Fast forward to 2018 and things have definitely become higher stakes.  We are bombarded with commercials where Discover gives you a rebate and then matches it at the end of the year, Capital One gives you a 1.5% rebate on all your purchases, and Chase gives 2 airline miles for every dollar you spend.

Credit cards are even offering one-time bonuses of hundreds of dollars if you sign up and spend a few thousand dollars in the first few months.

It’s easy to get overwhelmed by all the marketing and confused by all the intricacies of the rebate programs.  But there’s gold in them hills.

If you take a few minutes (and that’s really all it is) to understand the different programs and figure out which one is the best for you, it can be thousands of dollars each year in your pocket.  THOUSANDS OF DOLLARS.


The impact is huge

I’ve mentioned this a few times, but the Fox family plays the credit card roulette game and last year it amounted to about $4,000 in our pockets.  Given we spend about $120,000 a year on expenses, that’s almost 4% of our expenses each year.

You’re probably not surprised that I look at the impact with a spreadsheet, and when you do the numbers it has an enormous impact.  Let’s genericize it and look at my cousin Savvy Fox.  He’s a 22-year-old who graduated from college making $50,000 per year and spending about $40,000 per year of which 80% is stuff on his credit card.  His only major expense that he doesn’t put on his credit card is his rent (and eventually his mortgage); but for everything else he uses his credit card.  Of course, he pays his credit card off each month to avoid usurious interest expenses.

Over the course of his life his income and expenses will grow 3% each year until he’s spending $120,000 per year (like us) when it flattens out.

At age 22 Savvy spends a total of $40,000 of which $32,000 (80% of the total) he uses credit cards for.  Because he’s savvy with his credit cards, he gets about a 4% rebate on those purchases which is $1,280 for the year.  This is found money so Savvy invests it in and index fund and gets about 8% each year.  If he follows this plan for his entire working life (until age 65), when he retires this little exercise will give him a nice little treasure chest of about $660,000.

$660k for doing nothing more than maximizing his credit card rebates!!!  Go ahead and read that again.  In a world where the average net worth of a person is $80k, this little gambit by itself gives you 8x that.  BOOM!!!

To further illustrate the point, $660k is when Savvy is really savvy with credit cards and gets the 4% rebate.  If he wasn’t savvy and just got a 1% rebate, at age 65 he’d have $165k.  That’s really, really good; twice the net worth of the average American, but still HALF A MILLION less than what he could have.

That should show you the stakes.  Now let’s talk about how you get there.


Specifically what the Fox family does

It’s important to find a credit card with the highest rebate.  Right now the ranges from about 1.5% to 2.0%.  But the key is the sign-up bonus.  You can fairly easily get a credit card with a sign-up bonus of $200 and higher, and you get that if you spend something like $1,500 in the first few months.

Our family typically plays this game 2-3 times per year, for both Foxy and me.  So we sign up for a new credit card every few months.  Our normal spending easily gets us to that threshold for the bonus.  So take 3 new credit cards per year times 2 people, and you get a total of 6 new credit cards per year, each of which has a $200 rebate.  Just the rebate gets us at least $1,200.  Add to that 1.5% rebate on all our purchases that we can use a credit card for, let’s say $6,000 per month, and you have another $1,080.  That’s over $2,000 right there of found money.  That gets us to about 3.2%, but we do better.

As generous as personal credit card rebate programs are, business credit card rebate programs are better.  Since Foxy Lady and I hung up our own consulting shingles, we had to set up a business.  Because we have a business we can get business credit cards!!!

At Capital One a typical personal credit card has a rebate of $150 and a 1.5% cash back.  Not bad.  Their business credit card has a rebate of $500 and a 2% cash back.  Much better.  At Chase, they have a business credit card with a $700 rebate (after you account for the annual fee).  Now we’re talking.

You can easily imagine that if Foxy Lady gets two Capital One credit cards per year and two Chase cards, and I do the same, the rebate dollars add up.  I’ll do the math for you—it’s $4,800.  Add to that the cash back which is around 2%, and that’s another $1,440.  We’re getting about $6,200 EVERY YEAR for doing nothing more than using credit cards.  That’s a ton of money that is just sitting out there for the taking.


Bringing this full circle, there is a ton of money out there for people who put maybe two hours per year into getting it by playing the credit card game.  That money hasn’t always been there, so that by definition is DEFLATION.  Credit cards can be a huge inflation killer.

If you are interested in signing up for one of the cards we use, if we send you a link we get a bit of a bonus from Chase or Capital One.  If you want to do that, just shoot me an email.

Keeping up with the Jones . . . financially that is


Quick story

Los Angeles is a pretty bizzaro place in general, and this is especially true when it comes to personal finances.  Houses are so expensive, that it’s hard to understand how people do it.  Also, there’s a culture of conspicuous consumption that pervades everything; everyone looks like they’re spending a ton of money (and often they are).  A friend once very wisely said “In LA the BMW 3-series is what Honda Civic is to the rest of the country.”

Foxey and I both had good jobs, were saving a lot, and thought we were “making it”.  Yet, in a lot of ways we looked like the “poor” people on the street.  Our house was fairly average looking, we mowed our own lawn, we both drove old cars (a 1998 Toyota 4-Runner and a 2001 Honda Civic), and in general we had a humble existence.  There seemed a disconnect, and it took an emotional toll.  We were working so hard to save but it didn’t seem like it was making an impact.  Everyone else “looked” richer than we.  What gives?!?!

One day we were at a party, talking to a neighbor who was a mortgage broker.  The neighbor had a few glasses of wine in her and mentioned that she did the mortgages for several people on the street.  She didn’t violate anyone’s confidentiality, but she made a general statement that “you would be shocked at the shit-show that is most of our neighbor’s finances.”  She left it at that.

We’ll come back to this in a second.


Looking at the data

According to the US census, the median net worth for an American is . . . $80,000—and that includes home equity; if you strip out home equity it falls to $25,000.  Since this is an investing blog, and also since you know I don’t think you should rush to pay off your mortgage, let’s just look at net worth excluding home equity.

If your first reaction toggled between “that can’t be right” and “that’s really low” and “Holy Crap!!!” then you’re in good company—that was my reaction. My other reaction was “a really large percentage of their net worth is in their home, and that’s no good.”  But that’s a topic for another post.

The Census Bureau breaks it down every which way.  I think the most interesting is by age:

Age Net worth—with house Net worth—without house
Less than 35 years $6,900 $4,138
35 to 44 years $45,740 $18,197
45 to 54 years $100,404 $38,626
55 to 64 years $164,498 $66,547
.65 to 69 years $193,833 $66,168
.70 to 74 years $225,390 $68,716
.75 and over $197,758 $46,936


There’s an obvious trend that you would expect.  As you get older your net worth grows, peaks in your older years, and then towards the end starts to fall as you spend your nest egg.


People don’t like showing their rear-ends

How do you reconcile all this?  The obvious answer is that, sadly, many people live way beyond their means, showing off a glitzy façade while the financial foundation is completely rotted.  Back in LA, I am certain that we had a net worth higher than nearly all our neighbors.  We certainly had cars crappier than all our neighbors.  We were certainly one of the very few (only?) that mowed our own lawn.

No one wants to “seem” poor, especially when they aren’t.  As I said, it took a bit of a toll.  Fortunately, Foxey and I have good, midwestern roots and were raised to save a big part of our income.  But that’s no fun.  I’m a bit of a freak so I actually derive a lot of pleasure from buying index mutual funds and watching numbers on a spreadsheet get larger.  Foxey is much more normal, and enjoys buying actual things rather than just socking the money away.

Our neighbors, on the other hand, were not saving as much as we were.  If you believe the mortgage brokers comments, many were spending much more than they were making, and weren’t saving at all.  Looking at the national data, they had that in common with much of America.

I don’t want to seem as though I don’t think $100,000 is a lot of money.  It definitely is, but it doesn’t seem like a lot over a lifetime of savings.  Yet, that $100,000 is significantly more than most Americans have saved.  I’m guessing it is probably more than many had on our street, despite all outward appearances seeming to indicate otherwise.  It just seems weird and sad.


The point of all of this is that it’s good to know how much you have saved.  Hopefully, one of the things you get from this blog is how to take stock of where you are and what your plan is to achieve your financial goal.

It’s also good to put your savings into perspective.  Saving money is HARD work, especially emotionally given that we live in a world of conspicuous consumption where we are inundated, in the words of Tyler Durden: “Advertising has us chasing cars and clothes, working jobs we hate so we can buy shit we don’t need.”

It may not always be apparent, but I think it’s always worthwhile.  Amazingly, and very sadly too, just doing a little bit of savings over a long time will put you well ahead of the average American.  Take a look at those median values again—it’s sobering.

Maybe all of us savers need a special handshake or something so we can know that we aren’t alone.  I hope this post makes you as a saver feel that you aren’t alone and that it is worth while.

Dear 2017, You were pretty awesome

As the door closes on 2017, let’s take a few minutes to reminisce about what an incredible year 2017 was for investors.  For the Fox family it’s awesomeness was especially welcome given that our careers have shifted quite a bit, moving away from working for the man to working for ourselves (though, one of us happens to be a man).

Let’s look at the numbers, and figure out what it all means.


A tale of the tape

Like most investors, we had a really good 2017.  Here is how our portfolio broke down:

Investment

Portfolio weight

2017 return

US stocks (VTSAX)

52%

19%

International stocks (VTIAX)

37%

24%

Real Estate Investment Trusts (VGSLX)

7%

1%

Commodities (DJP)

2%

1%

Lending Club

2%

2%

TOTAL

100%

19%


Cha-ching

No matter how you look at it, 2017 was a GREAT year for stocks.  The US stock market did really well, growing 19%.  This can become really political really quickly when assigning credit/blame for such things to politicians.  However, I think it’s fair to say the Trump administration has been fairly pro-business.  That, along with the massive tax cut, definitely gave a boost to stocks.

Also, we saw economic growth really pick up while unemployment went to historic lows.  And all that was happening while inflation remained very low (more on this in a second).  If you put all that together, that’s a perfect recipe for awesome stock performances, and that’s exactly what we had.

Not to be outdone, international markets really kicked it into high gear.  Coming into 2017, US stocks had outperformed international stocks (pretty dramatically, actually) for four years in a row, every year since 2012.  That ended this year.  International stocks were up an astounding 24% compared to the paltry 19% that US stocks were able to muster.

I think that’s a good reminder that you can never really outsmart the market.  At the beginning of 2017 there was every reason to believe that US stocks would do better.  There was a ton of momentum in the US coming off of Trump’s election.  Plus, Europe seemed embroiled in political quagmires—Brexit, French elections with extreme candidates polling well, Greece being Greece.  Asia similarly seemed poised for another yawn of a year—Japan remain in a deflationary stagnation, Noth Korea being a total wild card, and it looked like China’s economy would slow down.

Our interpretations were dead wrong and those markets kicked butt, and international markets outpaced the US markets by 5%.  5%!!!  That’s a lot actually.


Inflation remains dormant

While all this was happening, inflation remained remarkably tame.  You know I spend a ton of time and energy talking about inflation because it has such a big impact on the purchasing power of your savings.

Huge returns like we had in 2017 are great, but what’s the point if those gains are all eaten away by higher prices?  The final reading for December will come out in mid-January, but preliminary readings indicate that inflation for the year will come in at about 2.1%.  2.1%!!!  As high as those 20-ish% returns were, that’s how low 2% inflation is.

As an investor, it really doesn’t get much better than that—high returns and low inflation.


Regrets, I’ve had a few

As you know, I always use New Years as a natural time to take stock (no pun intended) of things.  Now is a really good time to look at how we did, thinking about the things we did well with our investments and what we could have done better.

The high points of our investments were the US and International stocks.  We invested in all index mutual funds so we really didn’t do anything here.  Just “set it, and forget it”.  I suppose that speaks to how useless I am as an investor—the best part of our portfolio is the one that I did the least for.

Certainly, we did have some not-so-great investments.  I hate to be picky in a year where our portfolio grew 19%, but 2017 really exposed some stupid decisions that I had made.  Look at our returns, and the two “basic” investments that everyone should have (I even wrote a whole post on this very subject).  Those did the best.

The investments that did the worst were those “other” investments that aren’t one of the three basic ingredients.  I’m stupid, and that stupidity probably cost us $50,000 this year.  Ouch.

I’ve chatted about our commodities investment and our Lending Club investment, both of which have been incredible duds.  Currently, we’re in the process of eliminating those from our portfolio, so hopefully in 2018 we won’t have to deal with that crap.  Of course, because the investing gods like to humble stupid people, I am sure those two will perform spectacularly this year.

As for the REIT, over the longer-term it’s done fairly well (not as good as US stocks but better than International stocks).  This was just a down year, so that happens sometimes.  Still, it begs the question why we got into this instead of just sticking to the three ingredients, and I have some lame excuses, but nothing worth mentioning.  Hmmmm.


So there you have it.  2017 was an incredible year for being an investor.  Despite the couple misses we had, our two biggest investments really did well, so we’re happy.

How about you?  How did your portfolio do in 2017?

RIP Inflation

I’m trying to build my audience, so if you like this post, please share it on social media using the buttons right above.

Inflation is dead!!!  That’s quite a proclamation.  Is the stress of the holidays getting to me, making my mind soft?  Or is there something really to it?

If you are a regular reader of this column, you know that inflation can have an enormous impact on your financial plan.  You also know that I think that the government’s official measure of inflation (CPI) is way overstated.  No matter what you think, it’s undeniable that inflation is important and generally the lower the better.

If you don’t want to read the whole column, I’ll give you the answer: robots and engineering.  If you’re interested in my reasoning, read on.

Quick Crash Course

Inflation basically comes from one of two places:

  1. The government going insane and turning the presses on to print more money. This is hyperinflation and Zimbabwe and Venezuela lately and the Weimar Republic in the 1920s are good examples of this.
  2. The general rise in prices as people demand more for their labor and raw materials get more scarce, leading to increased prices.

Say what you will about the insanity of Washington, but #1 really isn’t a concern.  So inflation for the rich countries of the world really comes from #2.

Oil

The latest bout of really bad inflation in the US was in the 1970s and carried over to the early 1980s until Ronald Reagan and Paul Volker punched inflation in the face.  That was started by the oil shocks that OPEC imposed on the world.

Oil production was curtailed which drove prices higher.  Oil is a bit of a unique commodity in that we used it (and continue to do so although to a lesser degree) in nearly every aspect of life.  More on that in a minute.  Our world was based on oil so we really couldn’t do with less, so we had to pay more.  We really didn’t have a choice.  Prices rose (inflation).

Thirty years later in the mid-2000s oil prices dramatically rose again to $150 per barrel as demand from India and China shook the markets.  Again we had to use oil so we paid the higher prices, but then that story ended differently.  Technology had advanced so we could use less oil—natural gas powerplants, hybrid cars, solar panels, etc.—which took a bite out of the 2007 oil shock.

Also, and more importantly, technology also allowed fracking and oil sands to produce amazing amounts of oil in the US and Canada.  All the teeth were taken out of the OPEC threat.  Prices cratered over the next few years and have remained at very low levels.  If oil ever goes up again, more fracking and shale sands will be mined to bring prices back down.  We’re probably set with oil prices being moderately controlled for the next 100 years.

BOLD PREDICTION—Oil prices will never rise faster than 2% for the rest of my lifetime.

Other raw materials

Oil is a very unique raw material in that it is used everywhere.  Others aren’t nearly so ubiquitous.  That said, raw materials can increase in price.  However, when that happens our dynamic economy has shown an amazing ability to engineer products to substitute the more expensive raw materials for cheaper ones.

The price of copper has doubled over the last 30 years (from about $1.50 per pound to $3.00 per pound).  That should cause inflation yet think about engineering.  Thirty years ago how much copper was used in telephone line—a ton (literally)?  Now that’s all fiber-optic cable (mostly plastic—which is cheap) that carries a 1000x information at marginally higher prices.  Copper pipes used to be used exclusively in homes.  Now it’s PVC which is cheaper and more durable.  You get my point.

You can also have commodities like foodstuffs (cows and bushels of corn).  In the past those have increased in price significantly.  However, as an economist would predict, as the price goes up farmers plant more corn and ranchers husband more cattle.  That keeps everything at relatively steady prices.

When ever anything gets more expensive, businesses, with their profit motive, will find alternatives to do the job better at a lower price.  That is going to keep a major cap on inflation.

BOLD PREDICTION—There won’t be raw material whose price goes up significantly while also whose use increases significantly.

Robots

The largest component of inflation is human labor.  In the past, there has always been a general pull towards higher wages.  When the economy is weak (unemployment is high) that tends to slow or even stop.  When the economy is strong (unemployment is low) companies have to compete for workers and they do so by raising wages.  That leads to higher prices.

Of course, higher prices don’t always translate to inflation.  If a person is paid more but is much more productive (thanks to computers or other tools) that doesn’t lead to inflation, and if the productivity improvements are large enough will often lead to deflation.

However, and here’s the political hot potato, those productivity advances tend to be focused on the highest-skill workers.  Engineers now have computers to make them more productive; airline pilots have more advanced aircraft; construction workers have better tractors.  When most of those people got pay increases it was because they were more productive, no their impact on inflation was minimal.

The low-skill workers really haven’t gotten productivity enhancements, so any pay increases they got typically led to inflation.  But look at what has happened to all those low-skill jobs.  They have disappeared or are disappearing.  You don’t have gas-station attendants and grocery-store baggers anymore.  Cashiers are quickly disappearing.  Soon waitresses are going to disappear.

Most of the time the extinction of these jobs is because technology (robots) can replace them at a fraction of the cost.  Politically and socially this is deep water and we could debate this for hours whether this is good or bad.  But from an inflation perspective this is definitely keeping a cap on inflation.  If the wage for a low-skill job rises to fast, a robot or computer replaces it at a cost of pennies on the dollar.

Go to your grocery store and see all the self-checkout lines.  Each of those used to be manned by a low-skill worker.  Now one worker is overseeing 8 lines.  Many restaurants have self-order tablets which eliminate the need for waitresses (now you only need servers).  Of course countless low-skill factory jobs have been eliminated by robots.  You could go on and on.

This puts a huge cap on inflation, leading to much of what we see:

  1. Stagnant wages for low-skill workers
  2. Exponential growth of people-replacing machines
  3. Persistently low inflation.

BOLD PREDICTION—Wages for skilled workers will continue to increase while unskilled workers will decrease. Only a minimum wage will keep wages at the low end up, but that will lead to fewer low-skill jobs available.

The Federal Reserve has said it is baffled by the persistent low inflation in the face of fast economic growth, historically low interest rates, a low unemployment.  In the past those three ingredients always led to inflation, something that the Fed is chartered to control.  To me it seems like an easy situation to figure out, but I am smarter than a Nobel Prize winner ?.

It’s pretty simple—we aren’t going to have inflation because there are so many amazingly smart (and very well paid) engineers that can find any product (including people) whose prices are rising and replace them with cheaper substitutes.

Like I said before, there are social implications for this which make these issues very gray.  However, keeping to the black and white areas, I believe this means inflation will probably remain low for years to come.  As an investor that’s GREAT NEWS.